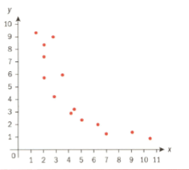
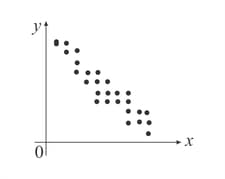
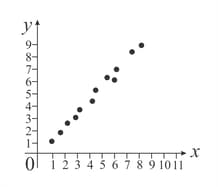
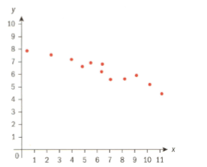
Describe whether each graph shows strong/weak/no correlation. If the variables are correlated, describe the correlation using the words positive/negative; linear/non-linear.
Important Questions on Modelling Relationships between Two Data Sets: Statistics for Bivariate Data
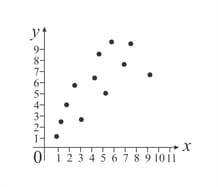
Describe whether each graph shows strong/weak/no correlation. If the variables are correlated, describe the correlation using the words positive/negative; linear/non-linear.
Describe whether each graph shows strong/weak/no correlation. If the variables are correlated, describe the correlation using the words positive/negative; linear/non-linear.
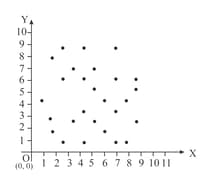
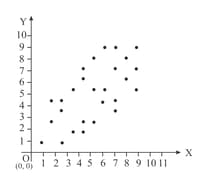
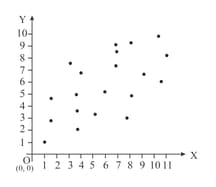
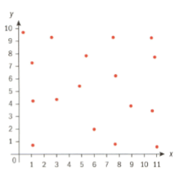
For these data sets: Is the relationship positive, negative or is there no association?
For these data sets: Is the relationship positive, negative or is there no association?
For these data sets: Is the relationship positive, negative or is there no association?
For these data sets: Is the relationship positive, negative or is there no association?
For these data sets: Is the relationship positive, negative or is there no association?
For these data sets: Is the relationship positive, negative or is there no association?