
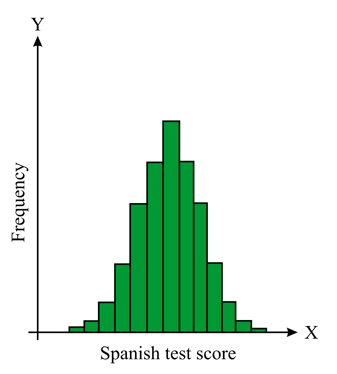
Determine whether the histogram is symmetrical and if it is unimodal, bimodal or multimodal and if it contains outliers.
Important Questions on City Skylines (Histograms)
The histogram shows the lengths of black rats.

Write down the modal class.
The histogram shows the lengths of black rats.

Find the class interval that contains the median.
The histogram shows the lengths of black rats.

Calculate an estimate for the range.
The histogram shows the lengths of black rats.

By first constructing a grouped frequency table, calculate an estimate for the mean length in (with no decimal places).
The histogram shows the lengths of black rats.
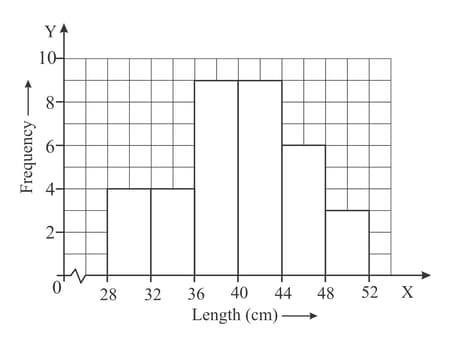
Describe the distribution.
The histogram shows the amounts of money, to the nearest , some families spend on food each week.
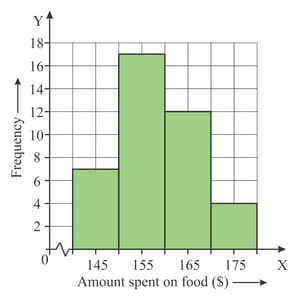
Write down the total number of families.
The histogram shows the amounts of money, to the nearest , some families spend on food each week.

Calculate an estimate for the mean amount spent on food.
The histogram shows the amounts of money, to the nearest , some families spend on food each week.

Comment on the distribution of the data.


