
Draw a bar graph for the following data.
Population of India in successive census years-
Year
Population
(in millions)(approx)
Source: Data from census of India and .
(in millions)(approx)
Important Questions on Data Handling
Draw a pie chart for the following data.
| Item of expenditure | Food | Health | Clothing | Education | Savings |
| Amount spent in rupees |
Draw a double bar graph for the following data.
Birth and Death rates of different states in .
| State | Birth Rate(Per ) | Death Rate(Per ) |
| Andhra Pradesh | ||
| Karnataka | ||
| Tamil Nadu | ||
| Kerala | ||
| Maharastra | ||
| Orissa |
Draw a pie chart for the following data.
Time spent by a child during a day-
| Time spent for | Sleep | School | Play | Others |
| Time spent |
The adjoining pie chart gives the expenditure on various items during a month for the family.
(The numbers written around the pie chart tell us the angles made by each sector at the centre.)
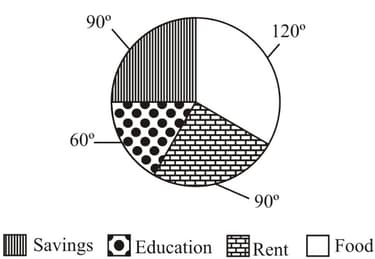
On which item is the expenditure minimum?
The adjoining pie chart gives the expenditure on various items during a month for the family.
(The numbers written around the pie chart tell us the angles made by each sector at the centre.)
On which item is the expenditure maximum?
The adjoining pie chart gives the expenditure on various items during a month for the family.
(The numbers written around the pie chart tell us the angles made by each sector at the centre.)

The monthly income of the family is . If the expenditure on rent is , find the value of .
The adjoining pie chart gives the expenditure on various items during a month for the family. (The numbers written around the pie chart tell us the angles made by each sector at the centre.)
The expenditure on food is . If the expenditure on education of children is , then find the value of .


