
Draw a cumulative frequency curve (ogive) for each of the following distributions:
Class interval
Frequency
Important Questions on Graphical Representation (Histograms and Ogives)
Draw a cumulative frequency curve (ogive) for each of the following distributions:
| Class interval | |||||
| Frequency |
Draw an ogive for each of the following distributions:
| Marks obtained | Less than | Less than | Less than | Less than | Less than |
| Number of students. |
Draw an ogive for each of the following distributions:
| Age in years (less than) | |||||||
| Cumulative frequency |
Construct a frequency distribution table for the numbers given below, using the class intervals etc.
and .
Use the table obtained to draw a histogram.
Construct a frequency distribution table for the numbers given below, using the class intervals etc.
and .
Use the table obtained to draw an ogive.
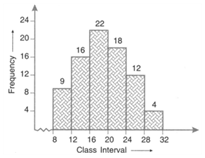
Use the information given in the adjoining histogram to construct a frequency table.

Use this table to construct an ogive.
| Class mark | |||||||
| Frequency |
From the distribution, given above, construct a frequency table.


