
Draw a histogram for the frequency distribution of the following data:
Class interval
Frequency
Important Questions on Data Handling
Draw a histogram for the frequency distribution of the following data:
| Class interval | ||||||
| Frequency |
Draw a histogram for the following data:
| Class interval | ||||||
| Frequency |
The following table shows the number of illiterate persons in the age group ( years) in a town. Represent the given data by means of a histogram.
| Age group (in years) | ||||||
| Number of illiterate persons |
The marks obtained (out of ) by students of a class in a test are given below:
Prepare a frequency distribution table for the above data using class intervals of equal width in which one class interval is (including and excluding ). From the frequency distribution table so obtained, draw a histogram.
The weights of students of a class are
Prepare a frequency distribution table using one class interval as , in which is included and excluded. using the above data, draw a histogram.
Look at the histogram given below and answer the question that follows:
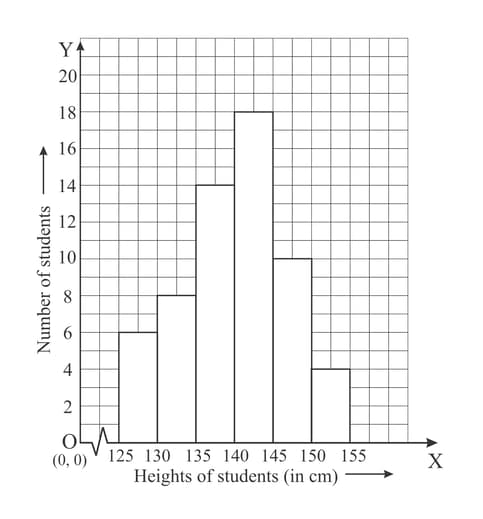
How many students have height more than or equal to but less than ?
Look at the histogram given below and answer the question that follows:

Which class interval has the least number of students?
Look at the histogram given below and answer the question that follows:

What is the class size?


