
Draw a pictograph for the following cars owned by the families in a particular locality.
Cars
Maruti Alto
Hyundai I
Honda city
Toyota Etios
Mahindra Bolero
Number of families
Draw a pictograph for the following cars owned by the families in a particular locality.
Answer the following question.
Which is the least popular car?
Important Questions on Data Handling
Read the pictograph showing different types of traffic at peak hour and answer the following question.
| Cycle |
|
| Scooter |  |
| Motorcycle |
|
| Car |  |
| Bus |
|


Each image represent vehicles in number.
What is the total number of vehicles running in peak hour?
Read the pictograph showing different types of traffic at peak hour.
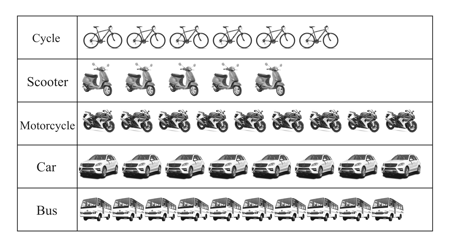
Each image represent vehicles in number. What is the most popular mode of transport? (Cycle/ Scooter/ Motorcycle/Car/Bus)
Read the pictograph showing different types of traffic at peak hour and answer the following question.
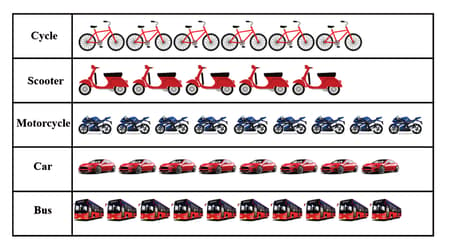
Scale: each image represent in number.
Which vehicle runs the minimum in number?
Read the pictograph showing different types of traffic at peak hour and answer the following question.
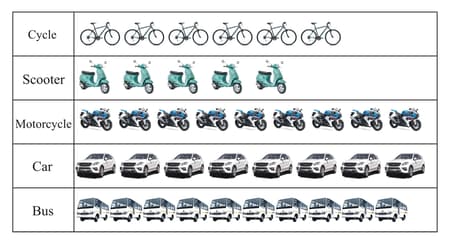
Scale: each image represent in number. Find the difference between the most and least popular vehicles running.
A group of boys are playing football on the field. They are wearing T-shirts of different colours. The trainer observes their individual skills and wants to find out the favourite colour of T-shirts worn by boys.
Number of T-shirts Black White Green Blue Orange Grey Red
Number of Boys
Draw the pictograph for T-shirts worn by boys. Use White, Green, Blue, Orange
Grey,
Answer the following question.
Which is the most favourite colour?
A group of boys are playing football on the field. They are wearing T-shirts of different colours. The trainer observes their individual skills and wants to find out the favourite colour of T-shirts worn by boys.
Number of T-shirts Black White Green Blue Orange Grey Red
Number of Boys
Draw the pictograph for T-shirts worn by boys. Use White, Green, Blue, Orange
Grey,
Answer the following question.
How many boys are wearing red colour T-shirts?
A group of boys are playing football on the field. They are wearing T-shirts of different colours. The trainer observes their individual skills and wants to find out the favourite colour of T-shirts worn by boys.
Number of T-shirts Black White Green Blue Orange Grey Red
Number of Boys
Draw the pictograph for T-shirts worn by boys. Use White, Green, Blue, Orange
Grey,
Answer the following question.
Which colour T-shirt is worn by the minimum number of boys?
A group of boys are playing football on the field. They are wearing T-shirts of different colours. The trainer observes their individual skills and wants to find out the favourite colour of T-shirts worn by boys.
Number of T-shirts Black White Green Blue Orange Grey Red
Number of Boys
Draw the pictograph for T-shirts worn by boys. Use White, Green, Blue, Orange
Grey,
Answer the following question.
Find the total number of boys playing on the field.


