
Draw a pictograph for the given data.
Month
June
July
August
September
Number of computers sold
(Choose your own suitable scales)
Important Questions on Statistics
The following table shows the number of tourists who visited the places in the month of May. Draw a pictograph.
| Place | Mahabalipuram | Vedanthangal | Hogenakkal | Ooty |
| Number of Tourists | 20,000 | 15,000 | 40,000 | 35,000 |
(Choose your own suitable scale)
The following pictograph shows the number of students playing different games in a school.
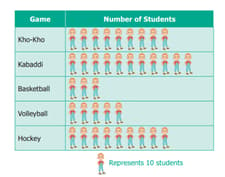
Answer the following question.
Which is the most popular game among the students?
The following pictograph shows the number of students who play different games in a school.

Find the number of students who play kabaddi.
The following pictograph shows the number of students who play different games in a school.
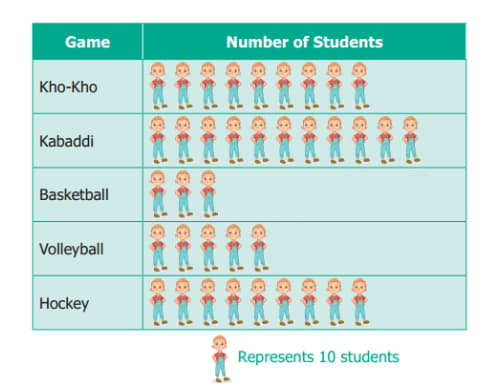
Which two games are played by an equal number of students?
The following pictograph shows the number of students who play different games in a school.

What is the difference between the number of students who play Kho-Kho and Hockey?
The following pictograph shows the number of students who play different games in a school.

Which is the least popular game among the students?


