
HARD
8th ICSE
IMPORTANT
Earn 100
Draw a pie chart for the percent of money spent on various types of books by a library in one year.
Type of book
Fiction
Classics
Sports
Biography
Magazines
Others
Important Questions on Graphical Representation of Data
MEDIUM
8th ICSE
IMPORTANT
The pie chart shows how a pupil spends his/her time in a Maths lesson which lasts 60 minutes.
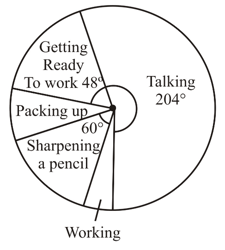
How much time does he/she spend:
getting ready to work
MEDIUM
8th ICSE
IMPORTANT
The pie chart shows how a pupil spends his/her time in a Maths lesson which lasts 60 minutes.

How much time does he/she spend:
talking
MEDIUM
8th ICSE
IMPORTANT
The pie chart shows how a pupil spends his/her time in a Maths lesson which lasts 60 minutes.
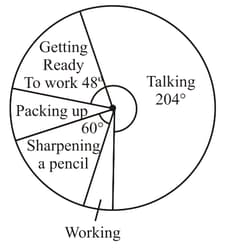
How much time does he/she spend:
sharpening pencil?
MEDIUM
8th ICSE
IMPORTANT
The pie chart shows how a pupil spends his/her time in a Maths lesson which lasts 60 minutes.

He/she spends 3 minutes working. What is the angle on the pie chart for the time spent working?


