Draw a pie chart showing the following information. The table shows the colours preferred by a group of people.
Colours
Number of people
Blue
Green
Red
Yellow
Total
Important Questions on Data Handling
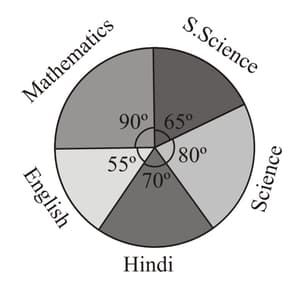
The adjoining pie chart gives the marks scored in an examination by a student in Hindi, English, Mathematics, Social Science and Science. If the total marks obtained by the student is . In which subject did the student score marks?
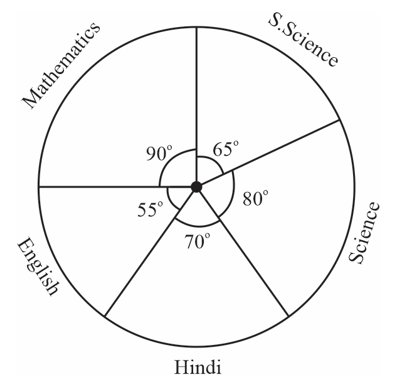
The adjoining pie chart gives the marks scored in an examination by a student in Hindi, English, Mathematics, Social Science and Science. If the total marks obtained by the student is , answer the following question.
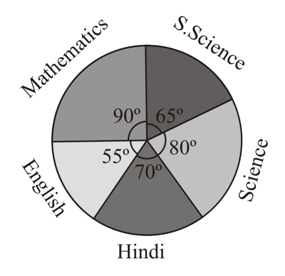
How many more marks were obtained by the student in Mathematics than in Hindi?
The adjoining pie chart gives the marks scored in an examination by a student in Hindi, English, Mathematics, Social Science and Science. If the total marks obtained by the student is , examine whether the sum of the marks obtained in Social Science and Mathematics is more than that in Science and Hindi.
The number of students in a hostel, speaking different languages is given below. Display the data in a pie chart.
| Language | Hindi | English | Marathi | Tamil | Bengali | Total |
| Number of students |
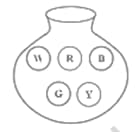
(Outcome here means the sector at which the pointer stops)