
Draw a stem-and-leaf plot and key for the given data sets.
.
Important Questions on Univariate Data Accessing Equal Opportunities
Draw a stem-and-leaf plot and key for the given data sets.
.
Draw a stem-and-leaf plot and key for the given data sets.
Find the measure of central tendency for the data sets. Show your working and give answers to the nearest tenth where necessary.
.
Find the range, quartiles and interquartile range for the data set.
.
Literacy rates can be measure of the quality of the educational system in a country. Data for the high-income countries and low-income countries with the lowest literacy rates are summarised below.
| High-income countries(%) | Low-income countries(%) |
| 95 | 19 |
| 95 | 27 |
| 97 | 30 |
| 97 | 36 |
| 98 | 37 |
| 98 | 38 |
| 98 | 38 |
| 98 | 39 |
| 99 | 40 |
| 99 | 43 |
| 99 | 44 |
| 100 | 48 |
| 100 | 48 |
| 100 | 49 |
| 100 | 52 |
Represent each set of data using a box-and-whisker plot.Draw both plots on the same axis.
Literacy rates can be measure of the quality of the educational system in a country. Data for the high-income countries and low-income countries with the lowest literacy rates are summarised below.
| High-income countries(%) | Low-income countries(%) |
| 95 | 19 |
| 95 | 27 |
| 97 | 30 |
| 97 | 36 |
| 98 | 37 |
| 98 | 38 |
| 98 | 38 |
| 98 | 39 |
| 99 | 40 |
| 99 | 43 |
| 99 | 44 |
| 100 | 48 |
| 100 | 48 |
| 100 | 49 |
| 100 | 52 |
Can you tell whether or not there is an unequal access to education in low and high-income countries?Which group seems to have better access?Use your representations to support your conclusion.
Students in high and low-income countries attend school for a specified number of days per year, as represented below.

Convert the data to a stem-and-leaf plot as well as a box-and-whisker plot.
Students in high and low-income countries attend school for a specified number of days per year, as represented below.
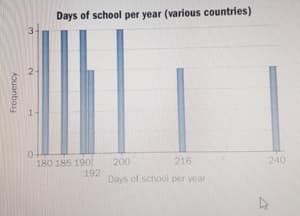
What are the advantages and disadvantages of each of the three representations?Explain.


