
Draw a tree diagram to show all possible outcomes when two un biased dice are thrown at the same time.
Important Questions on Probability Using Tree Diagrams and Venn Diagrams
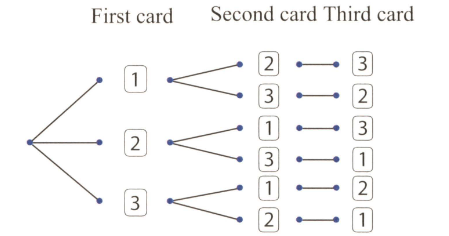
The tree diagram shows the possible outcomes when three number cards are placed in a container and then a card is drawn at random three times. Each time a card is drawn, it is placed on the table next to the previous card drawn.

Fill in the probabilities on each branch.
The tree diagram shows the possible outcomes when three number cards are placed in a container and then a card is drawn at random three times. Each time a card is drawn, it is placed on the table next to the previous card drawn.
How many three digits can be formed in this experiment?
The tree diagram shows the possible outcomes when three number cards are placed in a container and then a card is drawn at random three times. Each time a card is drawn, it is placed on the table next to the previous card drawn.

What is the probability of the three digit being ?
The tree diagram shows the possible outcomes when three number cards are placed in a container and then a card is drawn at random three times. Each time a card is drawn, it is placed on the table next to the previous card drawn.

What is the probability of the three digit being ?
The tree diagram shows the possible outcomes when three number cards are placed in a container and then a card is drawn at random three times. Each time a card is drawn, it is placed on the table next to the previous card drawn.
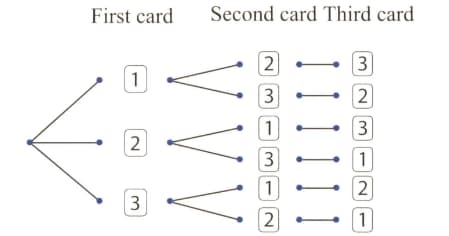
What is the probability of the three digit being even?
The tree diagram shows the possible outcomes when three number cards are placed in a container and then a card is drawn at random three times. Each time a card is drawn, it is placed on the table next to the previous card drawn.

What is the probability of the three digit being divisible by ?


