Draw an ogive for the following distribution.
Class Interval
Frequency
Important Questions on Frequency Distribution Tables and Graphs
| Class | |||||
| Frequency |
The cumulative frequency of the class of the above frequency distribution is _____.
The given table represents the exports (in ₹ crores) of four items A, B, C and D over a period of six years. Study the table and answer the question that follows.
|
Items Year |
A | B | C | D |
In which year, the exports of item were the average exports of item during six years;
The table below shows, children of a class sorted according to their marks in an examination.
| Marks | Number of children |
If we arrange the children from the one with the least mark to the one with the greatest, then what will be the assumed mark of the student?
Find the value of in following table.
| Term | Frequency | Cumulative Frequency |
The given table represents the exports ( incrores) of four items and over a period of six years. Study the table and answer the question that follows:
| Items | ||||
| Years | ||||
The total exports of item from to is what percentage less than the total exports of all the four items in :(Correct to one decimal place)
The following table gives the frequency of vowels used in the page of a book.
| Vowels | a | e | i | o | u |
| Frequency |
Study the table and answer the following question.
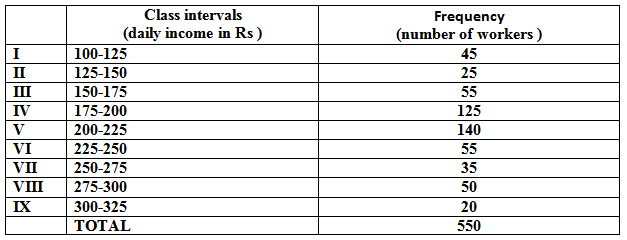
The frequency distribution of the daily income of workers of a factory is given below:

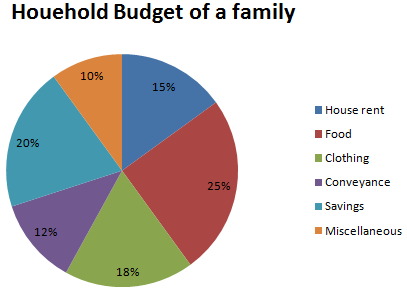
If total monthly income of a family is how much amount is spent on conveyance per month?
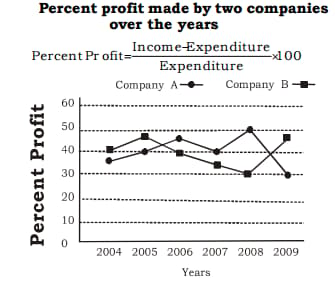
What is the ratio of the amount of profit earned by Company A to that by company B in the year
A dice was thrown times and the following outcomes were recorded:
Arrange the above data in ascending order and prepare the frequency table.
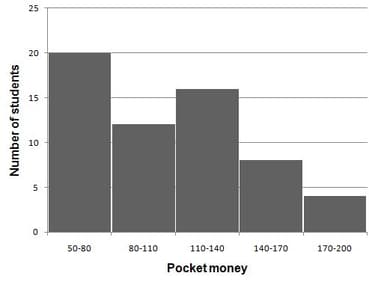
Maximum number of students received pocket money between ______
Directions: The pie-chart drawn below shows the spending's of a country on various sports during a particular year. Study the pie-chart carefully and answer the questions given below it.
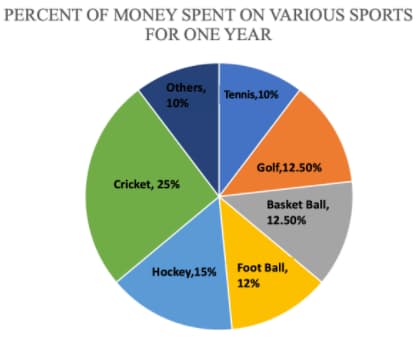
If the total amount spent on sports during the year was , the amount spent on cricket and hockey together was
Write the data given below in ascending order and prepare the frequency table.
.
The daily wages (in ) of workers in a factory are given below.
Arrange the above data in ascending order and prepare the frequency table.
Study the table and answer the following question.
The frequency distribution of the daily income of workers of a factory is given below: