Draw the distance vs time graph when the speed of a body increases uniformly.
Important Questions on Motion and Time
What is the graph drawn on the Cartesian axes called?
Draw a distance-time graph from the above data (Table 2) showing the distance covered by a racing car. Does the car have uniform motion?
| Time (s) |
Distance (in m) |
| 0 | 0 |
| 1 | 10 |
| 2 | 25 |
| 3 | 45 |
| 4 | 65 |
| 5 | 90 |
The table given below shows the distance of a car with time.
| Time (in ) | 0 | 1 | 2 | 3 | 4 |
| Distance (in ) | 0 | 10 | 20 | 30 | 40 |
Draw a distance-time graph for the above data.
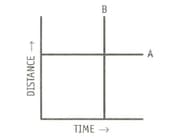
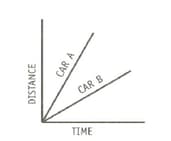
What can you say about the speeds of the two objects A and B from the distance-time graphs in Figure 2?
Draw a distance-time graph from the following data (Table 1) showing the distance covered by a racing car in fixed intervals of time. Calculate the speed of the car.
| Time (s) |
Distance (in m) From start point |
| 0 | 0 |
| 1 | 15 |
| 2 | 30 |
| 3 | 45 |
| 4 | 60 |
| 5 | 75 |
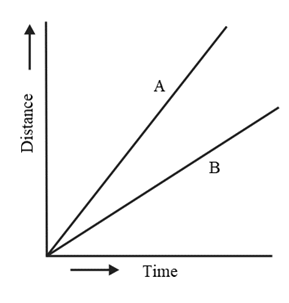
Figure shows the distance-time graph for the motion of two vehicles A and B. Which one of them is moving faster?
The three graphs A, B and C are speed vs time graphs of three cars. (None that these are not distance-time graphs)
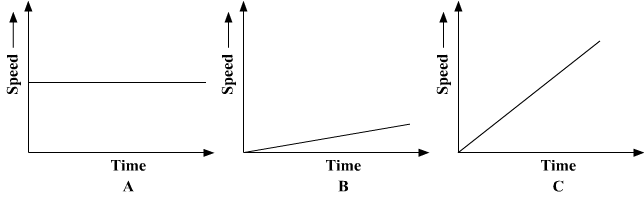
Identify the graphs from the clues.
1. Mr Nair is a gentle driver. He lets the car pick up speed slowly.
2. Ms Patnaik sometimes goes on a drive on an empty road. She enjoys cruising along at the same speed.
3. Ms Rushmore is a racing car driver. She has just started a race.
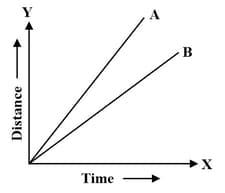
Figure 1 shows the distance-time graph for two racing cars, A and B. Which one of them won the race?
A car is moving with a constant speed.
The figure given alongside shows the distance-time graph for the motion of two cars A and B. Which one of them is moving faster ?