
Electrical experiments usually involve the reading of meters such as the voltmeters shown.
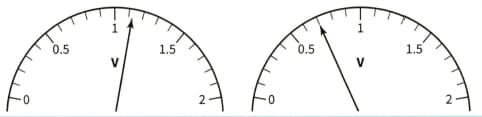
(a) What is the reading shown by each voltmeter, and the uncertainty in each reading?
Important Questions on Practical Skills at AS Level
Electrical experiments usually involve the reading of meters such as the voltmeters shown.

The voltmeters show the readings obtained when they were connected across two wires that were identical apart from their different lengths. The current in each wire was and the length of the wire was in the right diagram and in the left diagram.
Use the scale readings to test the hypothesis that the resistance of the Wire is proportional to length . Consider the effect of the uncertainties on your conclusion.
This apparatus can be used to test the hypothesis that , the time taken for a ball to roll down a plane from rest, is related to the distance by the formula , where is a constant.
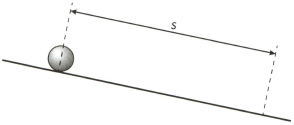
The ball is timed using a stopwatch over two different values of . Suggest problems with the experiment and how they might be overcome. You should consider problems in measuring the distance as well as the time. Also note what happens to the ball; it may not roll in the way that you expect.
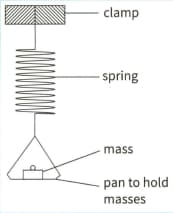
An experiment explores the relationship between the period of a vibrating spring and the mass in a pan holder. The student is instructed to set up the apparatus as shown here, with a mass of in the pan.
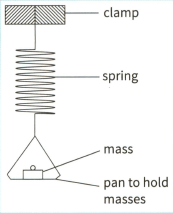
The student is then told to move the pan downwards by approximately and to release it so that it vibrates in a vertical direction. The student is asked to record the time taken for oscillations of the spring, and then to repeat the procedure, using masses between and until She has six sets of readings. Columns are provided in the table for and , the period of the pendulum.
This table shows the readings taken by a student with the different masses.
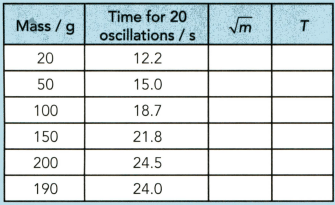
(a) Copy the table and include values for
An experiment explores the relationship between the period of a vibrating spring and the mass in a pan holder. The student is instructed to set up the apparatus as shown here, with a mass of in the pan.

The student is then told to move the pan downwards by approximately and to release it so that it vibrates in a vertical direction. The student is asked to record the time taken for oscillations of the spring, and then to repeat the procedure, using masses between and until She has six sets of readings. Columns are provided in the table for and , the period of the pendulum.
This table shows the readings taken by a student with the different masses.

(b) Plot a graph of on the -axis against on the -axis.
Draw the straight line of best fit.
An experiment explores the relationship between the period of a vibrating spring and the mass in a pan holder. The student is instructed to set up the apparatus as shown here, with a mass of in the pan.
The student is then told to move the pan downwards by approximately and to release it so that it vibrates in a vertical direction. The student is asked to record the time taken for oscillations of the spring, and then to repeat the procedure, using masses between and until She has six sets of readings. Columns are provided in the table for and , the period of the pendulum.
This table shows the readings taken by a student with the different masses.
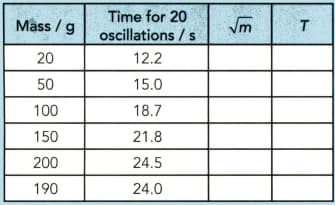
(c) Determine the gradient and -intercept of this line.
An experiment explores the relationship between the period of a vibrating spring and the mass in a pan holder. The student is instructed to set up the apparatus as shown here, with a mass of in the pan.

The student is then told to move the pan downwards by approximately and to release it so that it vibrates in a vertical direction. The student is asked to record the time taken for oscillations of the spring, and then to repeat the procedure, using masses between and until She has six sets of readings. Columns are provided in the table for and , the period of the pendulum.
This table shows the readings taken by a student with the different masses.

(d) The quantities and are related by the equation:
where and are constants.
Find the values of the two constants and . Give appropriate units.
A student releases a toy car to roll down a ramp, as shown.
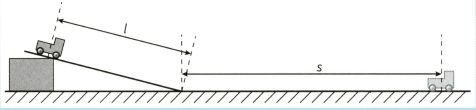
The student measures the distance from the middle of the car as it is released to the bottom of the ramp and the distance travelled along the straight section before the car stops. He also measures the time taken to travel the distance . He then repeats the experiment using a different value of .
The student obtained readings with and , taking each reading for and twice. The readings were:
: values for were ; values for were
values for were ; values for were .
(a) For the smaller value of , obtain a value for:
(i) the average value of
A student releases a toy car to roll down a ramp, as shown.
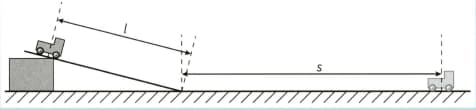
The student measures the distance from the middle of the car as it is released to the bottom of the ramp and the distance travelled along the straight section before the car stops. He also measures the time taken to travel the distance . He then repeats the experiment using a different value of .
The student obtained readings with and , taking each reading for and twice. The readings were:
: values for were ; values for were
values for were ; values for were .
(a) For the smaller value of , obtain a value for:
(ii) The absolute and percentage uncertainty in the value of


