
Examine the given graph and answer these questions-
Production of agricultural machinery by a company. (in thousands)
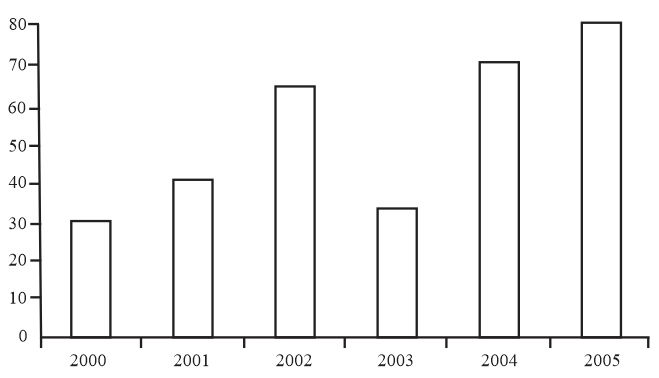
What was the difference in the production of agricultural machinery in the year and ?
Important Questions on Data Handling
Study the given pie chart and answer the question that follows.
The pie-chart represent the consumption of fuel by various Modes of transport of a country X in the year 2015. The consumption of fuel by various mode of transport of the country is million litres.
(The data shown here is only for the mathematical exercise. They do not represent actual figures of the country)
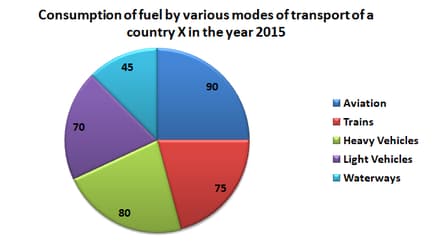
To obtain fuel, energy is required to run the machinery, which is to be produced by burning coal.
If of coal is burnt to produce of oil, then approximately what is the requirement of coal for the Trains sector?
Study the graph and answer the question.
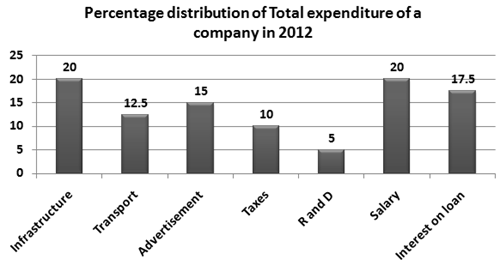
If the total amount of expenditure of the company is times the expenditure on transport, then the value of is _____.
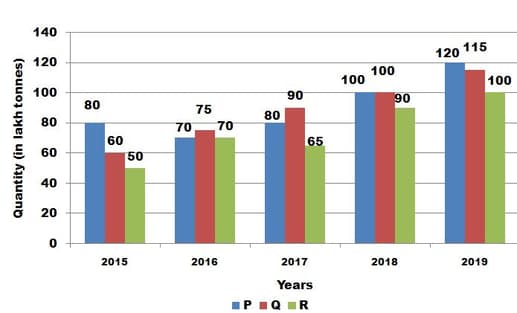
Study the following bar graph and answer the question given below:
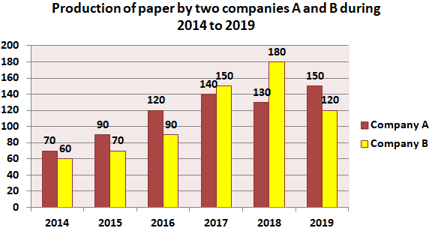
The average production of paper by Company B in less than the production of paper by Company A in the year ______.
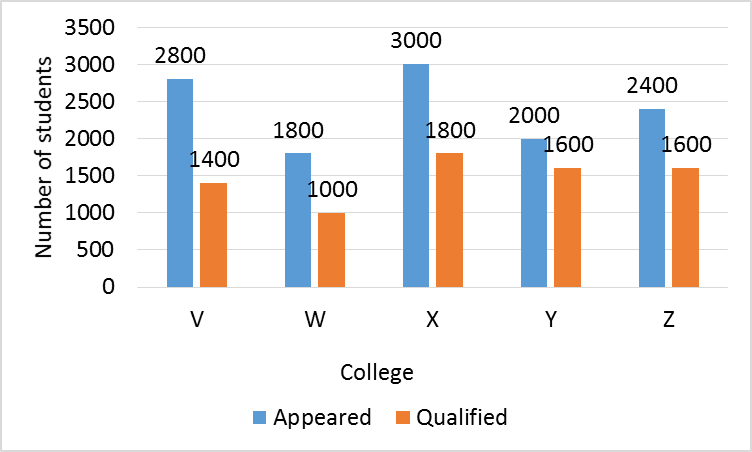
Study the following graph and answer the question that follows.
A number of students appeared and qualified, from various colleges, at a scholarship examination.
 .
.
What is the difference between the average number of students that appeared for the scholarship examination from all the given colleges, and the average number of students that qualified from all the colleges together?
Using the pie-chart answer the following:
If the annual income of the family is , the savings is:
Study the given graph and answer the question that follows.
The production and export of sugar (in ) by country during to .
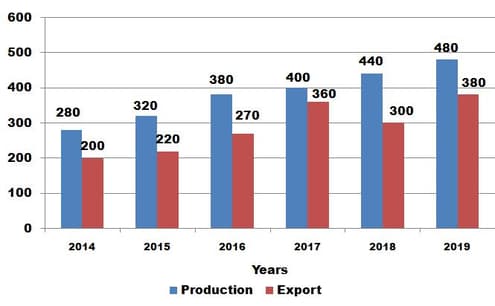
For which of the following years was the increase in the production of sugar as compared to that in its preceding year between
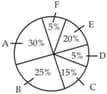
Directions: Study the given pie chart and answer the question that follows. Distribution of students studying in schools A, B, C, D and E. Total number of students is equal to .
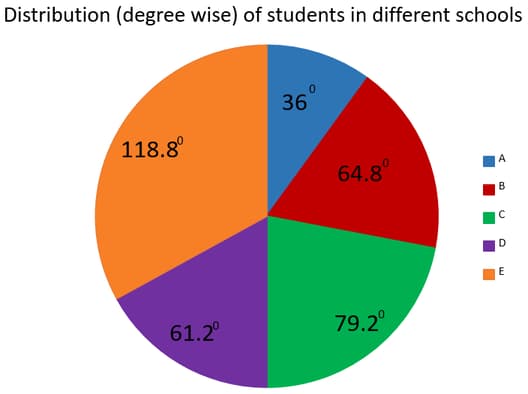
The number of students in school E exceeds the total number of students in schools A and B by , where lies between:
Study the given pie chart and answer the question that follows
The pie chart shows the distribution (degree wise) of the number of the computers sold by a shopkeeper during months.
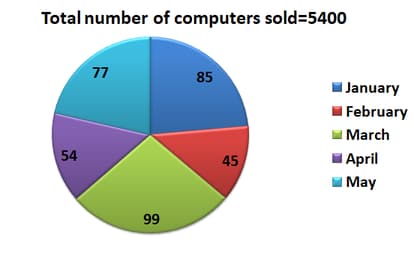
In which month was the number of computer sold about of the total number of computer sold in months?
Using the pie-chart answer the following:
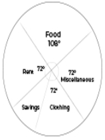
If the annual income of the family is , then the savings are:
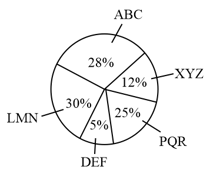
Study the following pie chart carefully and answer the question given below.
The pie chart shows information about $5$ mobile phone manufacturing companies in India. The total units of mobile phones manufactured by these companies together is $12,40,000$.
How many units of mobile phones are manufactured by company ‘DEF’?
Study the following graph and answer the question that follows.
The number of students that appeared and qualified from various colleges at a scholarship examination.
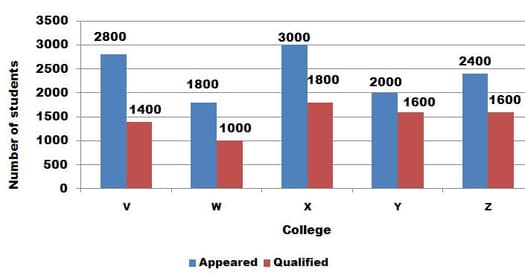
The average number of students that qualified in the examination from college is what percentage of the average number of students that appeared for the examination from the same colleges?
The HR department of a company prepared a report. The pie chart from this report shows number of employees in all the departments that the company has. Study the diagram and answer the following questions.
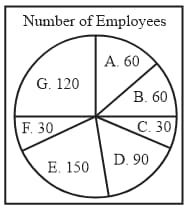
If the average monthly salary of the employees of this company is then, what is the total of the salaries (in lacs) paid to all the employees of this company?
Study the given pie charts and answer the question that follows.
The pie chart represents the distribution of candidates who were enrolled for the Bank Clerical Examination in Fig and the candidates (out of those enrolled) who passed the examination n Fig in five different institutes.
The total number of candidates enrolled in five different institutes
Fig :
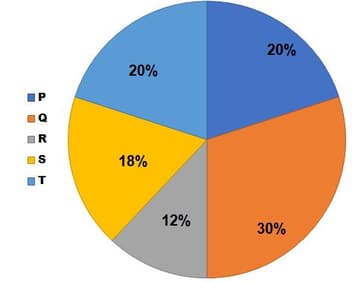
Total number of candidates who passed the examination from five institutes
Fig
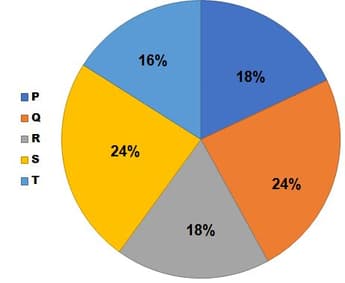
The percentage of the candidates who passed to the number of candidates enrolled for institutes together is ____________.
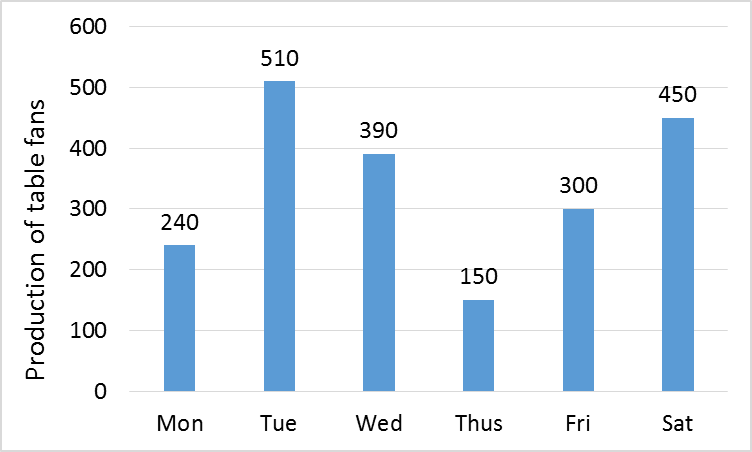
Study the given bar graph and answer the question that follows.
The bar graph shows the production of table fans in a factory during one week.
 .
.
The average production of table fans on Friday and Saturday exceeds the average production of table fans during the week by:
Study the given bar graph and answer the question that follows.
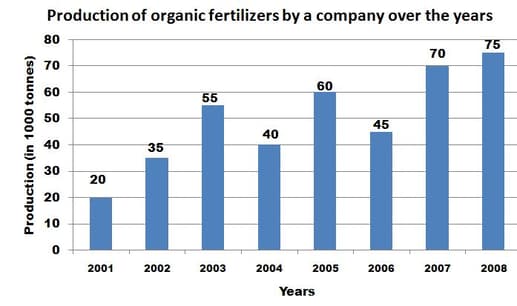
In which year was the percentage increase in production as compared to the previous year, the maximum?
Study the given graph and answer the question that follows.
The bar graph indicates the production of sugar (in ) by three different sugar companies over the years to .
The percentage rise in the production of sugar by company as compared to the previous years is the maximum in the year:
Study the given graph and answer the question that follows:
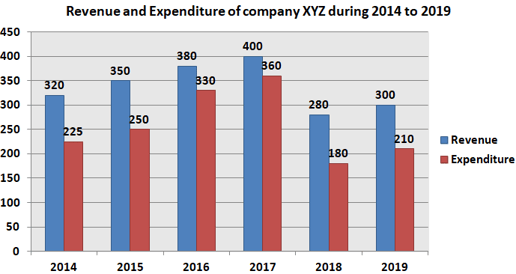
By what percentage is the average expenditure of the company in less than the revenue in ?
The following pie chart shows the percentage expenditure of a country on different heads. The total expenditure is (in billions). Study the chart and answer the question.
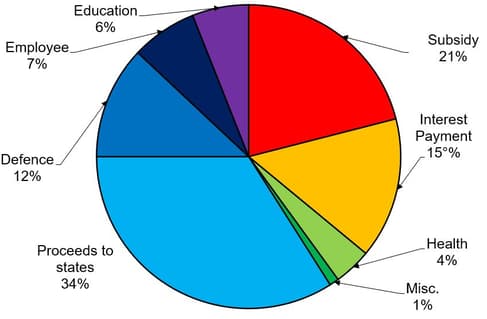
The expenditure on Education is what percentage less than the expenditure on Defence?
The given pie chart below informs us about non performing assets (NPA) of different banks till Dec. 2017.
If the total NPA of all the banks is Rs 300 lakh crore, then what will be the total NPA (in lakh crore) of bank ‘A’ till December 2017?
The given pie chart shows information about Non–Peforming Assets (NPA) Processed by the various banks of India till December 2017.
If the total NPAs under all the banks are worth Rs. lakh crores, then NPAs worth how much (in Rs. lakh crores) does Bank ‘D’ contain till December 2017?


