
Explain with the help of examples the positive, negative and zero displacement.
Important Questions on Motion
Using the following data plot the d-t graph of a moving car and answer the following questions:
| Time (a.m.) | 10.00 | 10.05 | 10.20 | 10.30 | 10.45 | 11.00 | 11.10 | 11.25 | 11.45 | 12.00 |
| Distance (km) | 0 | 5 | 10 | 22 | 25 | 30 | 34 | 40 | 50 | 55 |
(a) When was the car travelling at the greatest speed?
(b) What is the average speed of the car?
(c) What is the speed between to ?
(d) During a part of the journey, the car was forced to slow down to . During which period did this happen?
Derive the velocity-time relation using a speed-time graph
Derive the position-velocity relation using a speed-time graph.
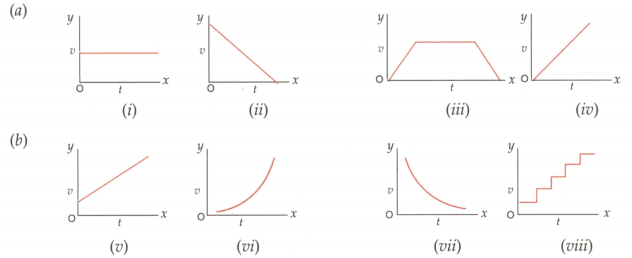
What can you say about the motion of a body from the following velocity-time graphs?
The values of displacement of a body at different instances of time are given below:
| Time (s) | 0 | 1 | 2 | 3 | 4 | 5 | 6 |
| Displacement (m) | 4 | 10 | 16 | 22 | 28 | 34 | 40 |
(a) Draw the displacement-time graph.
(b) What is the slope of the line obtained?
(c) What is the velocity of the body?
(d) Is the velocity uniform?
(e) Draw the v-t graph.


