
Figure Fig. represents a graph of kinetic energy of most energetic photoelectrons (in ), and frequency (v) for a metal used as cathode in photoelectric experiment. The threshold frequency of light for the photoelectric emission for the metal is
Important Questions on Photoelectric Emission and Production and Properties of X-Rays
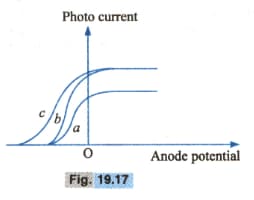
The figure, Fig. shows variation of photocurrent with anode potential for a photo-sensitive surface for three different radiations. Let and be the intensities and and be the frequencies for the curves a, b and c respectively. Then
In a photoelectric effect measurement, the stopping potential for a given metal is found to be volt when radiation of wavelength is used. If radiation of wavelength is used with the same metal then the stopping potential (in volts) will be
The threshold frequency for a metallic surface corresponds to an energy of and the stopping potential for a radiation incident on this surface is . The incident radiation lies in
In a photoelectric effect experiment, the slope of the graph between the stopping potential and the incident frequency will be of the order of
1. There is minimum frequency of light below which no photoelectrons are emitted.
2. Electric charge of photoelectrons is quantised
3. Maximum kinetic energy of photoelectrons depends only on the frequency of the light and not on its intensity
4. Even when metal surface is faintly illuminated the photoelectrons leaves the surface immediately


