
Figure shows the displacement- time graph for an oscillating mass. Use the graph to determine the frequency.
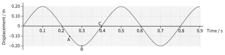
A displacement-time graph
Important Questions on Oscillations
Figure shows the displacement- time graph for an oscillating mass. Use the graph to determine the angular frequency.

A displacement-time graph
Figure shows the displacement- time graph for an oscillating mass. Use the graph to determine the displacement at A

A displacement-time graph
Figure shows the displacement- time graph for an oscillating mass. Use the graph to determine the velocity at B

A displacement-time graph
Figure shows the displacement- time graph for an oscillating mass. Use the graph to determine the velocity at C.

A displacement-time graph
An atom in a crystal vibrates with s.h.m. with a frequency of . The amplitude of its motion is
Sketch a graph to show how the displacement of the atom varies during one cycle.
An atom in a crystal vibrates with s.h.m. with a frequency of . The amplitude of its motion is . Use the graph to estimate the maximum velocity of the atom.
The vibration of a component in a machine is represented by the equation: . Where, the displacement is in metres. Determine the: Amplitude
The vibration of a component in a machine is represented by the equation:
.
Where, the displacement is in metres. Determine the frequency


