
Find out the answer of the following question by reading the graph.
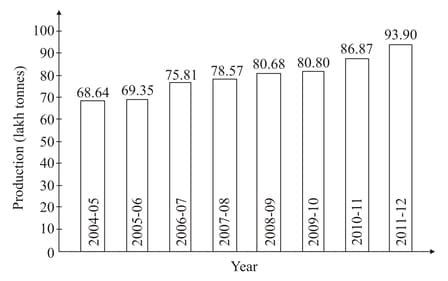
The production of wheat showed greatest change in which two years?
Important Questions on Data Analysis
The table given below shows the amount of annual rainfall in a particular city.
| Year | ||||||||||
| Total Rainfall (in cm) |
Study these figures related to rainfall, draw their bar graph and find at least five conclusions based on the graph.
Using the data given in the table, find the average height of a student in a class of .
| Height (In cm) | ||||||
| Number of students |
Using the data given in the table, find the average speed.
| Speed of running (km per hour) | ||||||
| Number of students |
Find the average of first natural numbers.
Price of petrol (in Rupees) in Bhubaneshwar (Orissa) during March-April, 2010 is given below. Find the mean of the data.
Data (in lac tons) regarding rice production of a state over an year period is given. Find the average of given data.
Find the median of the following data.
Find the median of the following data.


