
Find the missing frequencies in the following frequency distribution table, if the total frequency is and mode is .
Class
Frequency
Important Questions on Statistics
A TV reporter was given a task to prepare a report on the rainfall of the city Dispur of India in a particular year. After collecting the data, he analysed the data and prepared a report on the rainfall of the city. Using this report, he drew the following graph for a particular time period of days.
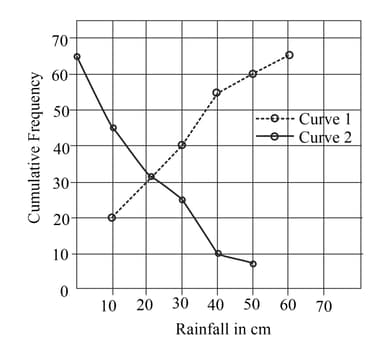
Obtain the mode of the data if mean rainfall is
The pyramid graph below shows the ages of the 548 Members of Parliament in the 17th Lok Sabha.
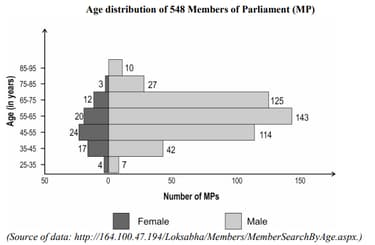
On an average, how much younger is a female MP than a male MP? Round your answer to the nearest whole number and show your work.
The table below gives the percentage distribution of female teachers in the primary schools of rural areas of various states and union territories (U.T.) of India. Find the mean percentage of female teachers by all three methods.
| Percentage of female teachers | |||||||
| Number of States/U.T. |
Find the missing frequencies in the following frequency distribution if it is known that the mean of the distribution is
(i)For a given data with observations the ‘less than ogive’ and ‘more than ogive’ intersect at .
The median of the data is .
(ii) The curve is drawn by taking upper limit of class interval along x-axis and cumulative frequency along y-axis is than ogive.
(iii) The mean of numbers is, the new mean will be if each observation is increased by .
(iv) The mean of seven consecutive natural numbers is ,then the largest number is . And smallest number of them is
18 Less 22 23 17
20 More 25 22 16
18 More 22 24 18
20 Less 25 22 16
At the World Athletics Championships held in Nairobi, Kenya in , Shaili Singh from India clinched the silver medal in the women’s long jump with a effort. She missed out on the gold medal to Sweden’s Maja Askag by .
The distance covered by Shaili in long jump practice are in metres. Find the mean and median.


