
Five 0.25 m2 quadrats were placed randomly in an area of grassland in the UK. The percentage of each quadrat occupied by each species of plant was estimated to the nearest 5% and recorded in the table.
Explain why the percentage cover for all the species in each quadrat adds up to more than 100%.
Important Questions on Classification Biodiversity and Conversation
Five 0.25 m2 quadrats were placed randomly in an area of grassland in the UK. The percentage of each quadrant occupied by each species of plant was estimated to the nearest 5% and recorded in the table.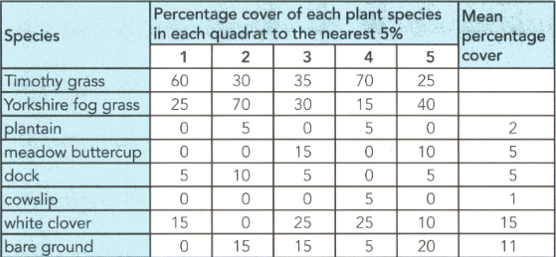
Suggest why the percentage cover was recorded to the nearest 5%.
Five 0.25 m2 quadrats were placed randomly in an area of grassland in the UK. The percentage of each quadrat occupied by each species of plant was estimated to the nearest 5% and recorded in the table.
Could these results are used to obtain a valid estimate of the species frequency for each species? Explain your answer.
Suggest four factors that affect plant biodiversity in a field ecosystem.
A sample of 39 ground beetles was captured from an area of waste ground measuring 10025 metres. Each animal was marked and then released. A second sample was caught on the following day. Of these, 20 had been marked.
Use these results to estimate the number of ground beetles in the population.
A sample of 39 ground beetles was captured from an area of waste ground measuring 10025 metres. Each animal was marked and then released. A second sample was caught on the following day. Of these, 20 had been marked. These results are used to estimate the number of ground beetles. State three assumptions that must be made in order to make this estimate.
Describe a method that you could use to check that the mark-release-recapture method gives a valid estimate of the ground beetle population in the area of waste ground.
Light is an important abiotic factor that determines the distribution and abundance of plants. Some plants are adapted to grow in areas of low light intensity. They are known as shade plants. Some students investigated the abundance of Dog’s Mercury. Mercurialis perennis, under forest trees in eight different locations. At each location, they used ten randomly positioned quadrats to measure the percentage cover of this shade plant.
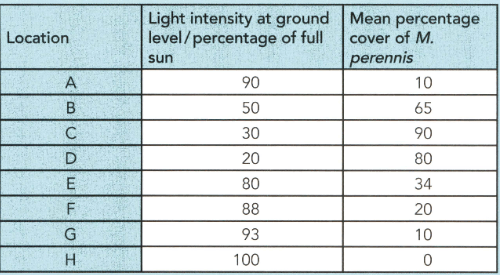
Draw a scatter graph to see if there is a correlation between light intensity beneath the canopy and the abundance of M. perennis.
Light is an important abiotic factor that determines the distribution and abundance of plants. Some plants are adapted to grow in areas of low light intensity. They are known as shade plants. Some students investigated the abundance of Dog’s Mercury. Mercurialis perennis, under forest trees in eight different locations. At each location, they used ten randomly positioned quadrats to measure the percentage cover of this shade plant.

State a null hypothesis for this investigation.


