
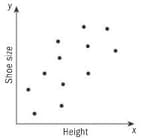
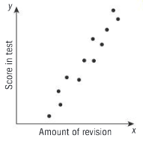
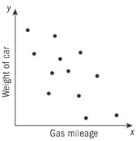
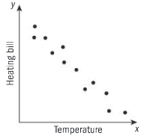
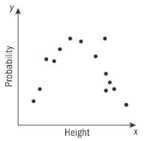
For each scatter plot, describe the form, direction and strength of the association between the variables. Interpret your description in the context of the data.
Important Questions on How did that Happen? (Scatter Graphs and Linear Regression)
For each scatter plot, describe the form, direction and strength of the association between the variables. Interpret your description in the context of the data.
For each scatter plot, describe the form, direction and strength of the association between the variables. Interpret your description in the context of the data.
For each scatter plot, describe the form, direction and strength of the association between the variables. Interpret your description in the context of the data.
For each scatter plot, describe the form, direction and strength of the association between the variables. Interpret your description in the context of the data.
The table shows data on students:
- Reaction distance, in a test to measure visual responses
- Height, in meters
- Weight, in kilograms
- Time, in seconds, taken to fasten their shoelaces.
A B C D E F G H I J Reaction distance (cm) 5.3 4.6 7.7 3.7 4.6 3.6 4.2 4.8 5.3 4.6 Height (m) 1.64 1.50 1.67 1.75 1.45 1.35 1.87 1.67 1.56 1.70 Weight (kg) 60 60 64 76 48 45 75 75 52 60 Fastening time (s) 9.1 10.5 13.4 9.6 10.5 9.2 8.8 8.5 10.4 6.3 Draw scatter diagram:
Plot height on the axis and weight on the axis.
The table shows data on students:
- Reaction distance, in a test to measure visual responses
- Height, in meters
- Weight, in kilograms
- Time, in seconds, taken to fasten their shoelaces.
| A | B | C | D | E | F | G | H | I | J | |
| Reaction distance (cm) | 5.3 | 4.6 | 7.7 | 3.7 | 4.6 | 3.6 | 4.2 | 4.8 | 5.3 | 4.6 |
| Height (m) | 1.64 | 1.50 | 1.67 | 1.75 | 1.45 | 1.35 | 1.87 | 1.67 | 1.56 | 1.70 |
| Weight (kg) | 60 | 60 | 64 | 76 | 48 | 45 | 75 | 75 | 52 | 60 |
| Fastening time (s) | 9.1 | 10.5 | 13.4 | 9.6 | 10.5 | 9.2 | 8.8 | 8.5 | 10.4 | 6.3 |
Draw scatter diagram:
Plot weight on the axis and reaction distance on the axis.
The table shows data on students:
- Reaction distance, in a test to measure visual responses
- Height, in meters
- Weight, in kilograms
- Time, in seconds, taken to fasten their shoelaces.
| A | B | C | D | E | F | G | H | I | J | |
| Reaction distance (cm) | 5.3 | 4.6 | 7.7 | 3.7 | 4.6 | 3.6 | 4.2 | 4.8 | 5.3 | 4.6 |
| Height (m) | 1.64 | 1.50 | 1.67 | 1.75 | 1.45 | 1.35 | 1.87 | 1.67 | 1.56 | 1.70 |
| Weight (kg) | 60 | 60 | 64 | 76 | 48 | 45 | 75 | 75 | 52 | 60 |
| Fastening time (s) | 9.1 | 10.5 | 13.4 | 9.6 | 10.5 | 9.2 | 8.8 | 8.5 | 10.4 | 6.3 |
Draw scatter diagram:
Plot reaction distance on the axis and fastening time on the axis.
The table shows data on students:
- Reaction distance, in a test to measure visual responses
- Height, in meters
- Weight, in kilograms
- Time, in seconds, taken to fasten their shoelaces.
| A | B | C | D | E | F | G | H | I | J | |
| Reaction distance (cm) | 5.3 | 4.6 | 7.7 | 3.7 | 4.6 | 3.6 | 4.2 | 4.8 | 5.3 | 4.6 |
| Height (m) | 1.64 | 1.50 | 1.67 | 1.75 | 1.45 | 1.35 | 1.87 | 1.67 | 1.56 | 1.70 |
| Weight (kg) | 60 | 60 | 64 | 76 | 48 | 45 | 75 | 75 | 52 | 60 |
| Fastening time (s) | 9.1 | 10.5 | 13.4 | 9.6 | 10.5 | 9.2 | 8.8 | 8.5 | 10.4 | 6.3 |
Draw scatter diagram:
Plot height on the axis and fastening time on the axis.


