
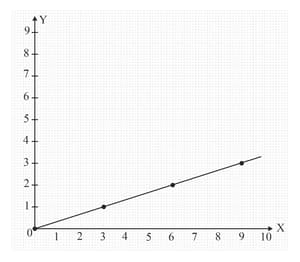
Form a table of values showing the coordinates of the points highlighted on the graph given below and hence write the equation showing the relationship between and .
Important Questions on Graphs
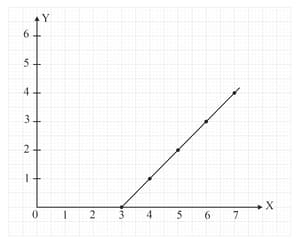
Form a table of values showing the coordinates of the points highlighted on the graph given below and hence write the equation showing the relationship between and .
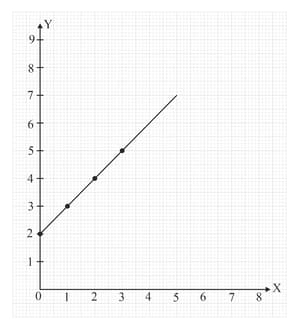
Form a table of values showing the coordinates of the points highlighted on the graph given below and hence write the equation showing the relationship between and .
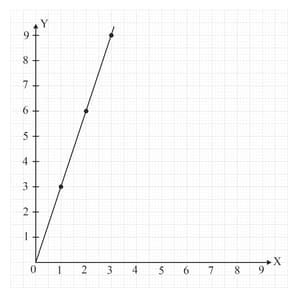
Form a table of values showing the coordinates of the points highlighted on the graph given below and hence write the equation showing the relationship between and .
Copy and complete the table of values for the given equation. Hence, draw the graph.
Copy and complete the table of values for the given equation. Hence, draw the graph.
| 1 | |||
Copy and complete the table of values for the given equation. Hence, draw the graph.
Copy and complete the table of values for the given equation. Hence, draw the graph.
Draw the graph of the function .


