
Formula for the mode of grouped data is:-
= Frequency of modal class
= Frequency of class preceding modal class
= Frequency of class succeeding modal class
= lower limit of modal class
= class size
Important Questions on Measures of Central Tendency
Read the following frequency distribution for two series of observations and answer the two items that follow: Series I and Series II is the given frequency.
| Class Interval | Series- I | Series- II |
| X | ||
| Y | Y | |
| Total |
What is the mode of frequency distribution of Series- II?
Consider the following statements:
Statement I : The value of a random variable having the highest frequency is mode.
Statement II : Mode is unique.
Which one of the following is correct in respect of the above statements?
The modal class of the frequency distribution given below is _____.
| Class | |||||
| Frequency |
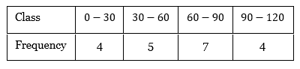
What is the mode of the distribution?
Making frequency distribution table from the given cumulative frequency distribution table, find the mode of the data.
| Class | ||||||||
| Frequency |
The wickets taken by a bowler in cricket matches are as follows:
The mode of the data is
What is the mode of the following list of numbers :
, , , , , , , , , and ?
| Number of Students per Teacher | Number of States |
| 15 – 20 | 3 |
| 20 – 25 | 8 |
| 25 – 30 | 9 |
| 30 – 35 | 10 |
| 35 – 40 | 3 |
| 40 – 45 | 0 |
| 45 – 50 | 0 |
| 50 – 55 | 2 |
For the following distribution, the modal class is
| Mark | Number of students |
|---|---|
| Below | |
| Below | |
| Below | |
| Below | |
| Below | |
| Below |


