
Given below (Fig.) is the bar graph indicating the marks obtained out of in mathematics paper by students. Read the bar graph and answer the following questions:
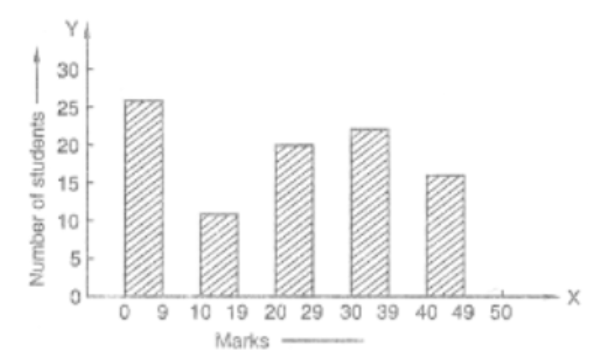
What is the number of students obtaining more than marks?
Important Questions on Data Handling-III (Bar Graphs)
Read the following bar graph and answer the following question:
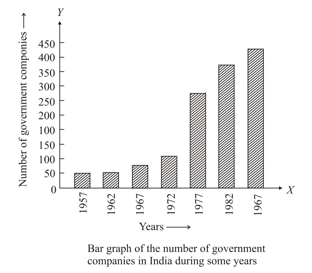
What is the information given by the bar graph?
Read the following bar graph and answer the following question:
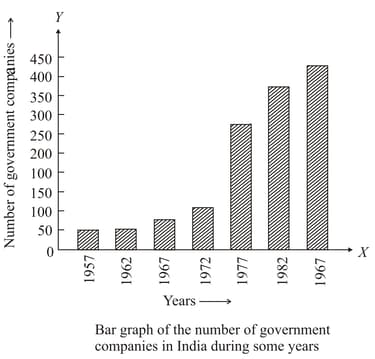
The number of government companies in to that in is .
Read the following bar graph and answer the following question:
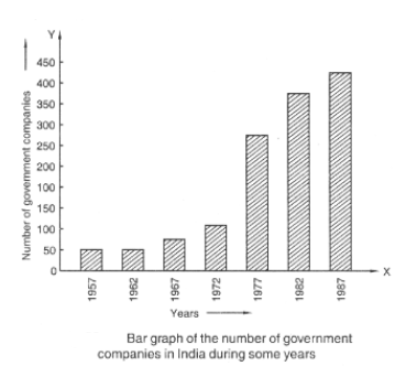
The number of government companies have decreased over the year to .
Read the following bar graph and answer the following question:

What information is given by the bar graph?
Read the following bar graph and answer the following question:
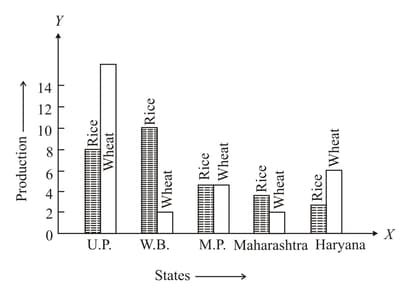
Which state is the largest producer of rice?
Read the following bar graph and answer the following question:

Which state is the largest producer of wheat?
Read the following bar graph and answer the following question:
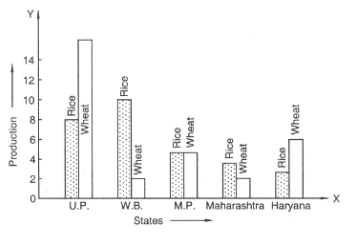
Which state has total production of rice and wheat as its maximum?
Read the following bar graph and answer the following question:

Which state has the total production of wheat and rice minimum?


