Given below is a (able of the stretch of a spring in a balance. Draw a graph on the basis of this table.
Stretch (in cm)
Weight (in g)
Important Questions on Histogram, Pie Chart and Line Graph
A car travelled for 14 hours, starting at 4:00 hours. The speed of the car at different hours is given below:
| Time | ||||||||
| Speed (in km/h) |
Draw a graph represent the above data:
The following table shows the sales of a commodity during the years .
| Years | 2004 | 2005 | 2006 | 2007 | 2008 | 2009 |
| Sales (in lakhs of (₹) | 1.6 | 1.8 | 2.2 | 3.4 | 5.2 | 6.8 |
Draw a graph to represent the above data.
6. The table given alongside gives the temperature in and its corresponding value in .
| Temperature | |||||
| Temperature |
Draw a graph by taking temperature in on X-axis and on Y-axis.
The given table shows the displacement of a body at different times. Draw a displacement-time graph to describe the motion of the body.
| Time (in s) | |||||
| Displacement (in m) |
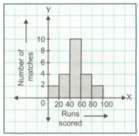
The given histogram shows the number of runs scored by a batsman in cricket matches
How many matches did he play in the highest run group?

The given histogram shows the number of runs scored by a batsman in cricket matches.
How many matches did he play in all?

The given histogram shows the number of runs scored by a batsman in 20-20 cricket matches.
In how many matches did he score less than runs?