
Given below is a frequency distribution table. Read it and answer the questions that follow:
Class interval
Frequency
Which interval has the lowest frequency?
Important Questions on Data Handling
Given below is a frequency distribution table. Read it and answer the questions that follow:
| Class interval | Frequency |
What is the class size?
The top speeds of thirty different land animals have been organised into a frequency table. Draw a histogram for the given data.
| Maximum speed | Frequency |
Given below is a pie chart showing the time spend by a group of children in different games. Observe it and answer the questions that follow.
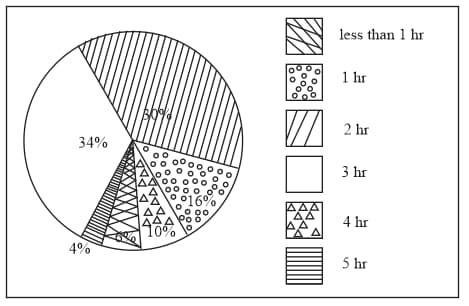
How many children spend at least one hour in playing games?
Given below is a pie chart showing the time spend by a group of children in different games. Observe it and answer the questions that follow.
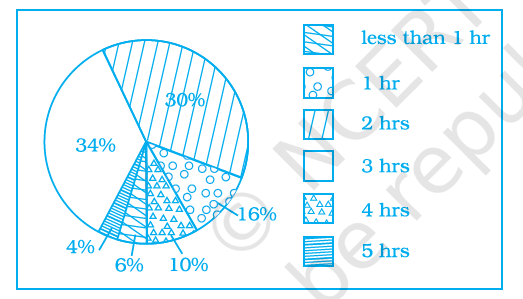
How many children spend more than hours in playing games?
Given below is a pie chart showing the time spend by a group of children in different games. Observe it and answer the questions that follow.

How many children spend or lesser hours in playing games?
Given below is a pie chart showing the time spend by a group of children in different games. Observe it and answer the questions that follow.

Which is greater-number of children who spend hours or more per day or number of children who play for less than one hour?
The pie chart on the right shows the result of a survey carried out to find the modes of travel used by the children to go to school. Study the pie chart and answer the questions that follow.

What is the most common mode of transport?
The pie chart on the right shows the result of a survey carried out to find the modes of travel used by the children to go to school. Study the pie chart and answer the questions that follow.
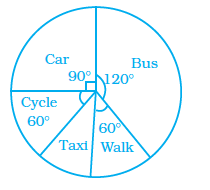
What fraction of children travels by car?


