HARD
NEET
IMPORTANT
Earn 100
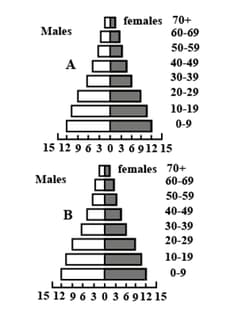
Given figures represent comparative age-sex pyramids for India for the years 1971 (figure A) and 1991 (figure B), over the 20-year period.
Study carefully the pyramids and select the correct statement regarding these.
. 
25% studentsanswered this correctly
Important Questions on Organisms and Populations
MEDIUM
NEET
IMPORTANT
Age-sex structure of a population can be depicted in the following figures:
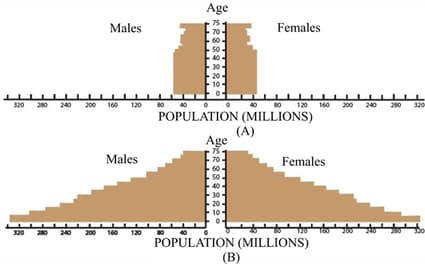
Study carefully the above age-sex pyramids and select the correct statements regarding these.
EASY
NEET
IMPORTANT
In a given population of 2000 individuals, 80 births and 125 deaths were reported over a given period of time.
Which of the following graphs will correspond to it?
EASY
NEET
IMPORTANT
The total number of individuals of a species per unit geographic area is called
MEDIUM
NEET
IMPORTANT
In some cases, population density is measured in terms of biomass rather than in terms of numbers because
HARD
NEET
IMPORTANT
Which of the following is not an example of using relative density to measure population density in a certain area?
MEDIUM
NEET
IMPORTANT
For which of the following cases, population density can be easily determined by utilising a non-biological parameter?
HARD
NEET
IMPORTANT
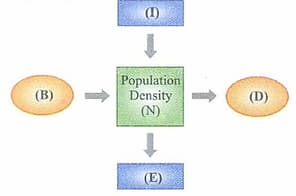
The given figure represents different factors affecting population density (N). If B = natality, D = mortality, E = emigration and I = immigration; then select the incorrect option regarding these.
MEDIUM
NEET
IMPORTANT
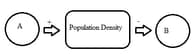
The density of a population, in a given habitat, during a given period, fluctuates due to changes in certain basic processes. On this basis, fill up boxes A and B in the given flowchart with the correct option.