
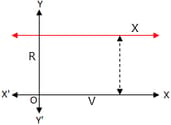
Graph of resistance against voltage for a wire of pure iron kept at a constant temperature:

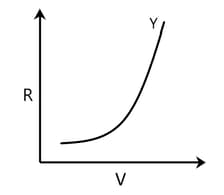
Graph of resistance against voltage for a wire of impure iron kept at a constant temperature:

Explain how the graphs would change if the wires were kept at a higher, but still constant, temperature.


Important Questions on Resistance and Resistivity

Table shows the results of an experiment to measure the resistance of a carbon resistor whose resistance is given by the manufacturer as .
Potential difference/ V | Current / A |
2.1 | 0.040 |
4.0 | 0.079 |
6.3 | .0128 |
7.9 | 0.192 |
10.0 | 0.202 |
12.1 | 0.250 |
Plot a graph to show the Characteristic of this resistor.

Table shows the results of an experiment to measure the resistance of a carbon resistor whose resistance is given by the manufacturer as
.
Potential difference/ V | Current / A |
2.1 | 0.040 |
4.0 | 0.079 |
6.3 | .0128 |
7.9 | 0.192 |
10.0 | 0.202 |
12.1 | 0.250 |
Do the points appear to fall on a straight line that passes through the origin of the graph?

Table shows the results of an experiment to measure the resistance of a carbon resistor whose resistance is given by the manufacturer as .
Potential difference/ V | Current / A |
2.1 | 0.040 |
4.0 | 0.079 |
6.3 | .0128 |
7.9 | 0.192 |
10.0 | 0.202 |
12.1 | 0.250 |
Does the value of the resistance fall within the range given by the manufacturer?


The readings in this table are recorded from an experiment to measure the resistivity of silver.
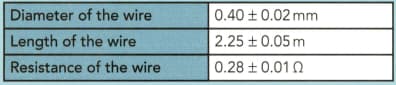
Calculate the resistivity of silver.

The readings in this table are recorded from an experiment to measure the resistivity of silver.
Diameter of the wire | 0.40 ± 0.2 mm |
Length of wire | 2.25 ± 0.5 m |
Resistance of wire | 0.28 ± 0.01 Ω |
Calculate the percentage uncertainty in each of the variables.

The readings in this table are recorded from an experiment to measure the resistivity of silver.
Use your table to calculate the absolute uncertainty in the value of the resistivity obtained in the experiment.
