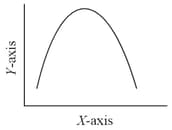
How does concentration of enzyme substrate and product affect the rate of reaction?
Important Questions on Biomolecules
The graph given below shows the Michaelis-Menten kinetics for two reactions ( and ; represented as solid and dotted lines, respectively). Enzymes and have values, and , respectively. The respective values for and are and . ().
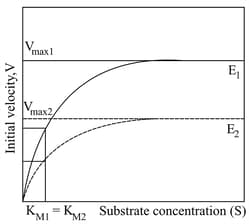
The correct statement(s) for reactions and is/are
Given below are two statements :
Statement I : Low temperature preserves the enzyme in a temporarily inactive state whereas high temperature destroys enzymatic activity because proteins are denatured by heat.
Statement II : When the inhibitor closely resembles the substrate in its molecular structure and inhibits the activity of the enzyme, it is known as competitive inhibitor.
In the light of the above statements, choose the correct answer from the options given below :

| List-I | List-II | List-III | |||
| A | Coenzymes are organic compound | i | No structure similarities | I | Ribose-5 phosphate isomerase |
| B | Isomerases | ii | Differ from inorganic catalysis | II | During catalysis |
| C | Non-competitive enzyme inhibition | iii | Catalyzing interconversion of optical positional isomers | III | Operates at high temperatures also |
| D | Enzyme catalysts | iv | With the apoenzyme only as a transient | IV | Metal ion of copper |
The correct match is:
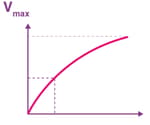
A scientist performed enzyme kinetics and obtained velocity as a function of substrate concentration and the values are given in the table below.
The of the substrate could
The following graph shows the concentration of substrate on enzyme activity:
What does the -axis represent?
The graph below depicts the velocity of an enzyme-catalyzed reaction vs. substrate concentration. Identify the alphabets with the correct descriptions.
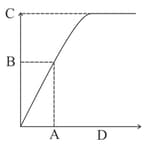
I. Enzyme activity
II. Substrate concentration at maximum velocity
III. Substrate concentration at which half of the maximum velocity
IV. Half of the maximum velocity
| (i) | Rate of reaction | Enzymatic activity |
| (ii) | Enzymatic activity | Rate of reaction |
| (iii) | Enzymatic activity | /Temperature |
| (iv) | /Temperature | Enzymatic activity |