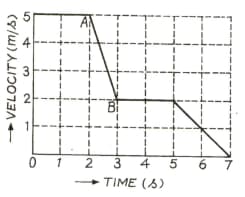
How far does the runner whose time velocity graph is shown in the figure travel in seconds? What is the acceleration of the runner at second?
Important Questions on Motion in One and Two Dimensions
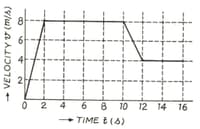
The time-velocity graph of a car is shown in the figure. Calculate the acceleration from to .
The time-velocity graph of a car is shown in the figure. Calculate the distance travelled in the last seconds.

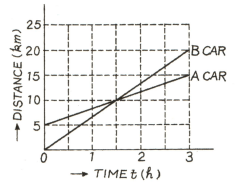
The figure shows the time-distance graphs of two cars which start simultaneously in the same direction. Calculate from the graph by how much distance the car was ahead of car initially.

The figure shows the time-distance graphs of two cars which start simultaneously in the same direction. Calculate from the graph which car is moving faster? What their speeds are?
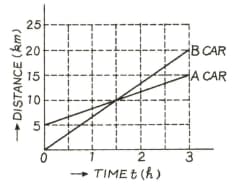
The figure shows the time-distance graphs of two cars which start simultaneously in the same direction. Calculate from the graph After how much time and at which place the car will catch car ?
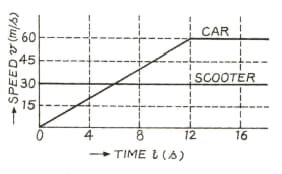
As soon as a car just starts from rest in a certain direction, a scooter moving with a uniform speed overtakes the car. Their time-speed graphs are shown in the adjoining figure. Calculate from the graph the acceleration of the car initially.
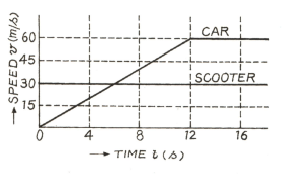
As soon as a car just starts from rest in a certain direction, a scooter moving with a uniform speed overtakes the car. Their time-speed graphs are shown in the adjoining figure. Calculate from the graph the time at which the speed of the car becomes equals to the speed of the scooter.

As soon as a car just starts from rest in a certain direction, a scooter moving with a uniform speed overtakes the car. Their time-speed graphs are shown in the adjoining figure. Calculate from the graph the difference in the distances traversed by the scooter and the car in seconds.