
How is the mode calculated by the graphical method? Explain.
Important Questions on Statistics
Find the mode from the following data:
| Class : | |||||||
| Frequency |
Find the mode of the following distribution.
| Class : | |||||||
| Frequency |
Determine the value of the mode for the following sets of data:
Find the mode of the following distribution by drawing a histogram
| Mid value | |||||||
| Frequency |
Also state the modal class.
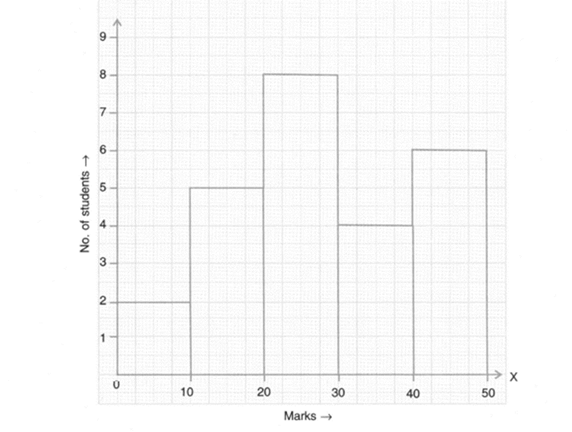
The histogram below represents the scores obtained by students in a Mathematics mental test. Use the data to:
To determine the modal class.
The following data gives distribution of heights of a group of 60 college students:
| Height(in cms) | Number of students |
Draw the histogram for this distribution and find the modal height. Check this result by using algebraic formula.
Pocket money (in, per month) of students is
Form a frequency table with a grouping of etc. Also find the modal pocket money (by graphical method) as well as by using formula.
Draw a histogram for the following distribution:
| Wt. in | ||||||
| Number of students |
Hence, estimate the modal weight.
The mode of the distribution for the following data is:
Determine the value of the mode for the following sets of data:
In a class test, the marks (out of ) of students were:
Draw a tally chart and a frequency table. Hence, find
the mode
(i) A histogram can be used to compute the mode
(ii) When there is change of scale, the median is affected
(iii) Variance is not affected when there is change of origin and scale
Mode can be computed from histogram
Median is not independent of change of scale
Variance is independent of change of origin and scale
Which of these is - are correct


