
If you could draw a velocity–time graph for any of the oscillators described in figure, what would it look like? Would it be a curve like the one shown in Figure a, or triangular (saw-toothed) like the one shown in Figure b?

Important Questions on Oscillations
From the displacement–time graph shown in Figure, determine the amplitude, period and frequency of the oscillations represented.
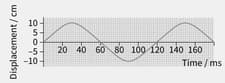
A displacement–time graph for an oscillator.
Figure b shows two oscillations that are out of phase. By what fraction of an oscillation are they out of phase?
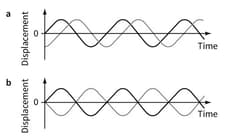
Illustrating the idea of phase difference.
Why would it not make sense to ask the same question about Figure c?
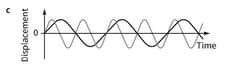
Illustrating the idea of phase difference.
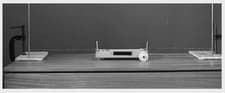
Identify the features of the motion of the trolley in Figure that satisfy the three requirements for Simple Harmonic Motion.
Explain why the motion of someone jumping up and down on a trampoline is not simple harmonic motion. (Their feet lose contact with the trampoline during each bounce.)
Use the graphs shown in Figure to determine the values of the following quantities:
Amplitude

Use the graphs shown in Figure to determine the values of the following quantities: Time period

Use the graphs shown in Figure to determine the values of the following quantities:
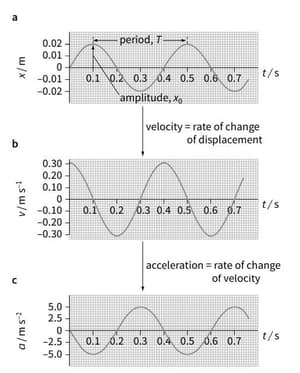
Maximum velocity


