
In there were an estimated giant pandas in China. Calculate the likely panda population in if there is an annual growth in the population of .
Important Questions on Managing Money
In there were an estimated giant pandas in China. Calculate the likely panda population in if there is an annual decline in the population of .
A population of microbes in a laboratory doubles every day. At the start of the period, the population is estimated to be microbes. Copy and complete this table to show the growth in the population.
| Time (Days) | |||||||||
| Total number of microbes (Millions) |
A population of microbes in a laboratory doubles every day. At the start of the period, the population is estimated to be microbes. Draw a graph to show the growth in the population over days.
| Time (Days) | |||||||||
| Total number of microbes (Millions) |
A population of microbes in a laboratory doubles every day. At the start of the period, the population is estimated to be microbes. Draw a graph to show the growth in the population over days. Then use the graph to determine the microbe population after days.
| Time (Days) | |||||||||
| Total number of microbes (Millions) |
A population of microbes in a laboratory doubles every day. At the start of the period, the population is estimated to be microbes. Draw a graph to show the growth in the population over days. Then use the graph to determine how long it will take the microbe population to reach million.
| Time (Days) | |||||||||
| Total number of microbes (Millions) |
This graph shows how a radio-active substance loses its radioactivity over time.
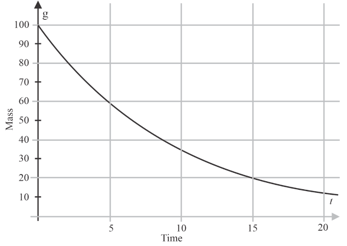
The half life of the substance is how long it takes to decay to half of its original mass. What is the half life of this substance?
This graph shows how a radio-active substance loses its radioactivity over time.
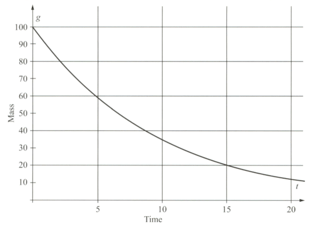
What mass of the substance is left after minutes?


