
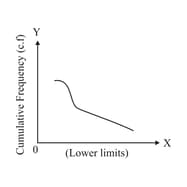
In More than Ogive curve, cumulative frequencies are marked against the lower limit of the respective classes.
Important Questions on Statistics
During the medical check-up of students of a class, their weights were recorded as follows. Draw a less than type of ogive for the given data:
| Weight in kg | Number of students |
| Less than | |
| Less than | |
| Less than | |
| Less than | |
| Less than | |
| Less than | |
| Less than | |
| Less than |
From the frequency distribution table given below, draw less than ogive:
| Marks obtained | |||||
| Frequency |
An insurance policy agent found the following data for distribution of ages of policy holders. Draw a ''less than type'' (below) of ogive for the given data:
| Age(in years) | Number of policy holders |
| Below | |
| Below | |
| Below | |
| Below | |
| Below | |
| Below | |
| Below |
Find the median of the data from the above graph.
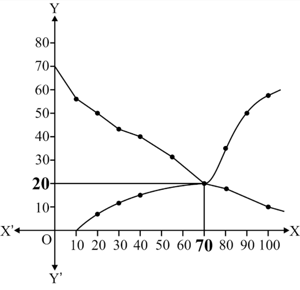
State the type for curve A and curve

During the medical check-up of students of a class, their weights were recorded as follows:
| Weight (in kg ) | Number of students |
| Less than Less than Less than Less than Less than Less than Less than Less than |
Draw a less than type ogive for the given data. Hence, obtain the median weight from the graph and verify the result by using the formula.
50 students enter for a school javelin throw competition. The distance (in metre) thrown are recorded below
| Distance (in m) | |||||
| Number of students |
Draw a cumulative frequency curve (less than type) and calculate the median distance drawn by using this curve.
Profit (in ) earned by a company during the period 2011-2016 are given
below. Draw a simple bar diagram to this data showing profit
| Year | Profit |
Find the year in which the company earned a maximum profit.
The following table gives production yield per hectare of wheat of farms of a village.
| Production yield | ||||||
| Number of farmers |
Change the distribution to a more than type distribution and draw its ogive.
The production yield per hectare of wheat of some farms of a village are given in the following table:
| Production yield (in kg/ha) | |||||||||
| Number of farms |
Draw a less than type ogive and a more than type ogive for this data
The following distribution gives the daily income of workers of a factory.
| Daily income (in Rupees) | |||||
| Number of workers |
Convert the distribution above to a less than type cumulative frequency distribution, and draw its ogive.
The given distribution shows the number of wickets taken by the bowlers in one-day international cricket matches:
| Number of Wickets | Less than | Less than | Less than | Less than | Less than | Less than | Less than | Less than |
| Number of bowlers |
Draw a ‘less than type’ ogive from the above data. Find the median.
The following is the frequency distribution of duration for calls made on a mobile phones.
| Duration (in s) | Number of calls |
Calculate the average duration (in sec) of a call and also find the median from a cumulative frequency curve.
The distribution of heights (in ) of children is given below
| Height (in ) | Number of Children |
Draw a less than type cumulative frequency curve for this data and use it to compute median height of the children.


