
In a bar chart, the scale of unit length represents students. Then students are represented by a bar of length units.
Important Questions on Data Handling
Krish scored full marks in the final mathematics examination. The range of the class is . The lowest marks in the class are _____.
The bar graph shows the number of hours spent by a programmer on computers per week. Read the graph carefully and answer the following question:
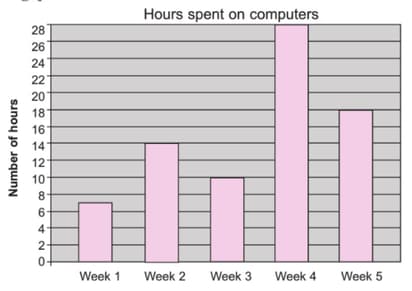
The number of hours spent in the third week is _____ hours.
The bar graph shows the number of hours spent by a programmer on computers per week. Read the graph carefully and answer the following question:

The average number of hours spent on computers per week is _____ hours.
The bar graph shows the number of hours spent by a programmer on computers per week. Read the graph carefully and answer the following question:
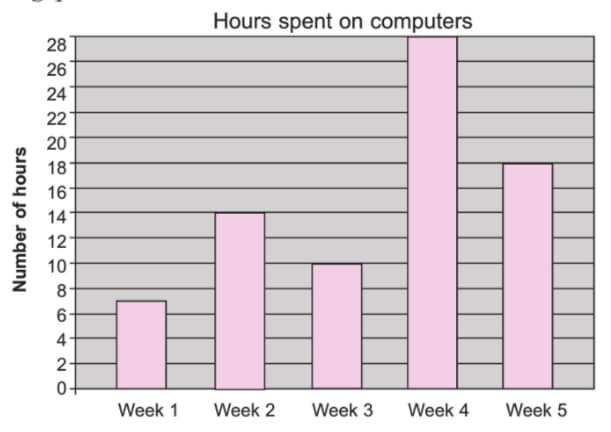
The ratio of the number of hours spent in the first week to that of the number of hours spent in the second week is _____.


