
In a city numbers of people speaking different languages (percent wise) is given as:
Kashmiri
Urdu
Hindi
English
Dogri
Others
Draw a chapatti chart (Pie chart) for the data given.
Important Questions on Smart Charts
The given pie chart shows the breakup of total number of the employees of a company working in different offices (A, B, C, D and E).
Total number of employees
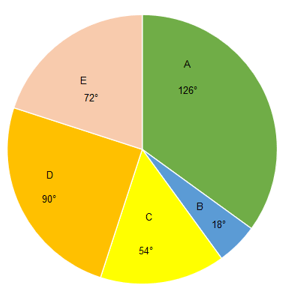
What is the number of offices in which the number of employees is between ?
Comprehension:
Directions: The Pie Chart given below presents the number of laptops as a percentage of the total number of laptops in an office delivered by six different companies.
The central angles shown in the Pie Chart are not as per any chosen scale.
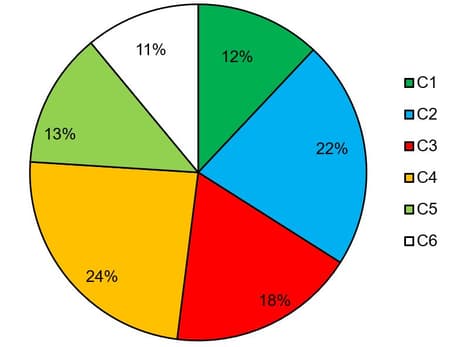
What is the central angle in degrees (correct up to one decimal place) corresponding to the laptops delivered by Company C6?
Read the given pie-chart and answer the questions below.
Degree of cost incurred in Expenditure
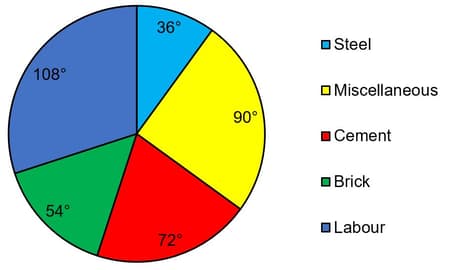
The expenditure on steel is what percent of the expenditure on cement?
Directions: The Pie chart given below presents the percentage of the number of motorcycles of different colours out of the total number of motorcycles, parked in an area. The central angles shown in the Pie chart are not as per any chosen scale.
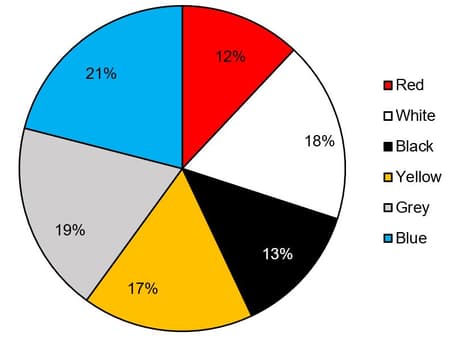
What is the central angle (nearest to one degree) corresponding to the motorcycles of black colour?
Read the given pie-chart and answer the questions below.
Degree of cost incurred in Expenditure

What is the total expenditure (in percent) on labour charges?
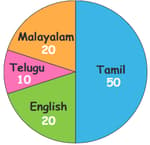
Answer the following questions by using given data.
Number of people who speak English.

| The drink they like | Number of children |
| Milk | |
| Coffee | |
| Tea |
Show the liking for Tea, Coffee or Milk in a Chapati Chart.
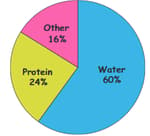
Write down the percentage of content in human body from the given pie-chart.
The number of varieties of ice-cream in an ice-cream parlour is given below as a pie chart.
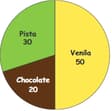
Find the total number of ice creams?
Look at the given data on the kind of food preferred by different students. Colour the given pie chart according to the given data using different colours and label it accordingly.
| South Indian | |
| North Indian | |
| Chinese | |
| Mexican |
A group of teenagers were asked to tell how they would like to spend their free time. The results are shown in the table given below. Display the data in a pie chart. Also answer the following.
| Exercise | Number of students |
| Sports | |
| Partying with friends | |
| Watching TV | |
| Reading books |
Express each exercise as a fraction.
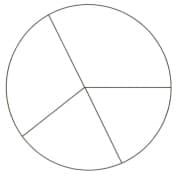
The circle graph shows how children of the class come to school.

One-fourth of the students come by
Answer the following questions by using given data.
Number of people who speak Telugu.

The circle graph (pie chart) shows the number of items purchased by a coffee shop. Looking at the circle graph, answer the following question.
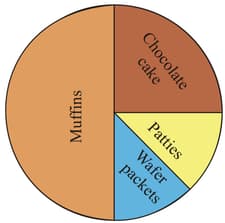
Are the number of patties purchased equal to the number of wafer packets?
Answer the following questions by using given data.
Number of people who speak Malayalam.
A group of teenagers were asked to tell how they would like to spend their free time. The results are shown in the table given below. Display the data in a pie chart. Also answer the following.
| Exercise | Number of students |
| Sports | |
| Partying with friends | |
| Watching TV | |
| Reading books |
How many students like party with friends?
Draw a  for Yes and a
  for No.
A semi-circle is half of a circle.
The circle graph (pie chart) shows the number of items purchased by a coffee shop. Looking at the circle graph, answer the following question.

Are the number of chocolate cakes purchased equal to of the total number of items?


