
MEDIUM
8th Foundation
IMPORTANT
Earn 100
In a school only out of students can participate in a competition. What is the probability of the students who do not make it to the competition?
50% studentsanswered this correctly
Important Questions on Data Handling
MEDIUM
8th Foundation
IMPORTANT

MEDIUM
8th Foundation
IMPORTANT
MEDIUM
8th Foundation
IMPORTANT
MEDIUM
8th Foundation
IMPORTANT
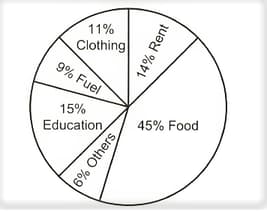
If the total income of the family is , then the amount spent on rent and food together is __________.
MEDIUM
8th Foundation
IMPORTANT
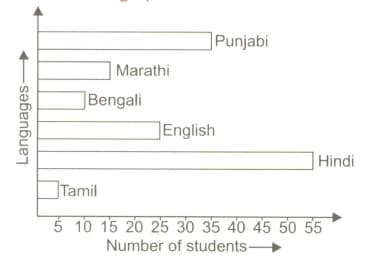
i. How many students are there in the hostel?
ii. What is the ratio of the number of students speaking Punjabi to those speaking English?
iii. What is the percentage of the students speaking Marathi over those speaking Hindi?
MEDIUM
8th Foundation
IMPORTANT
Look at the given below data.
The frequency distribution of the data is given here.
| Group | Tally marks | Frequency |
| Group | Tally marks | Frequency |
Which of the above tables is the frequency table of the given data?


