
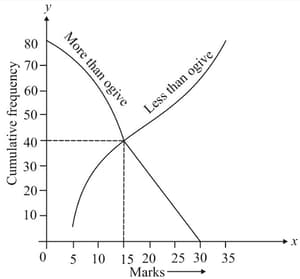
In the below figure the value of the median of the data using the graph of less than ogive and more than ogive is
Important Questions on Statistics
In " less than type ogive'', the axis represents
| No. of Accidents | ||||||||
| Frequency |
In how many cases or more accidents occur ?
The given table represents the exports (in ₹ crores) of four items A, B, C and D over a period of six years. Study the table and answer the question that follows.
|
Items Year |
A | B | C | D |
In which year, the exports of item were the average exports of item during six years;
coordinate of intersecting point of two ogives, represents
The given table represents the exports ( incrores) of four items and over a period of six years. Study the table and answer the question that follows:
| Items | ||||
| Years | ||||
The total exports of item from to is what percentage less than the total exports of all the four items in :(Correct to one decimal place)
What is the median of the given data?
.
Find the range and mode of the data
| Class | |||||
| Frequency |
The cumulative frequency of the class of the above frequency distribution is _____.
The following table gives the frequency of vowels used in the page of a book.
| Vowels | a | e | i | o | u |
| Frequency |


