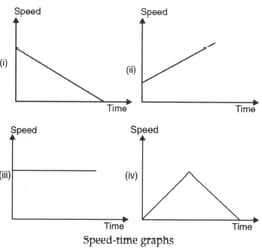
In the given fig., four cases of the speed-time graph are given. In which case is the speed constant? In which case is the speed increasing? In which case is the speed decreasing? What happens in the fourth case?
Important Questions on Motion
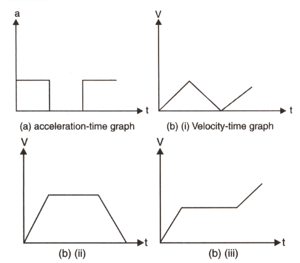
The acceleration-time graph for a body is shown in fig.(a). Which of the following figures from fig.(b) would show the velocity-time graph for the same body?
Plot a distance-time graph for uniform speed.
Which of the following graph is possible?
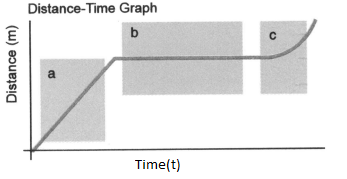
Interpret the regions , and in the following graph.
The time of arrival and departure of a train at three stations , and and the distance of stations and from are given in the table.
| Station | Distance from | Time of arrival (hours) | Time of departure (hours) |
Plot and interpret the distance-time graph for the train assuming that its motion between any two stations is uniform.
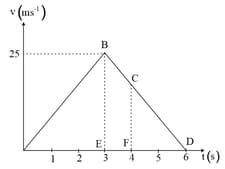
Study the velocity-time graph and calculate:
(a) The acceleration from to
(b) The acceleration from to
(c) The distance covered in region
(d) The average velocity from to
(e) The distance covered in region .