
In the half-yearly examination, the marks scored in each subject out of are given below:
Subjects
English
Hindi
Maths
Science
Social Science
Marks scored
Represent the above data by a bar graph and answer the following questions:
In which subject are the maximum marks obtained?
Important Questions on Data Handling
In the half-yearly examination, the marks scored in each subject out of are given below:
| Subjects | English | Hindi | Maths | Science | Social Science |
| Marks scored |
Represent the above data by a bar graph and answer the following questions:
In which subject does the student need to improve a lot?
In the half-yearly examination, the marks scored in each subject out of are given below:
| Subjects | English | Hindi | Maths | Science | Social Science |
| Marks scored |
Represent the above data by a bar graph and answer the following questions:
What is the difference between the maximum and minimum marks?
Rajesh went to a store and picked up some stationery items given below:
|
Item |
Ball pens | Erasers | Sharpeners | Scales | Pencils |
| Numbers |
Represent the data in the form of a pictograph.
The following table shows the number of patients who visited of a city hospital during a particular week:
| Day | Monday | Tuesday | Wednesday | Thursday | Friday | Saturday |
| No. of patients |
Draw a bar graph to represents the above data and answer the following questions:
On which day did the maximum number of patients visit the hospital?
The following table shows the number of patients who visited of a city hospital during a particular week:
| Day | Monday | Tuesday | Wednesday | Thursday | Friday | Saturday |
| No. of patients |
Draw a bar graph to represents the above data and answer the following questions:
On which day did the minimum number of patients visit the hospital?
The following table shows the number of patients who visited of a city hospital during a particular week:
| Day | Monday | Tuesday | Wednesday | Thursday | Friday | Saturday |
| No. of patients |
Draw a bar graph to represents the above data and answer the following questions:
How many patients visited on Saturday?The bar graph shows the number of toys produced by a factory during a certain week.
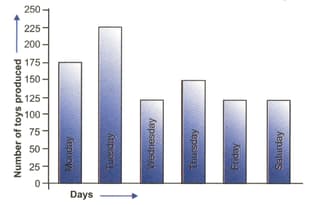
Answer the following question;
On which day the maximum number of toys were produced?
The bar graph shows the number of toys produced by a factory during a certain week.

Answer the following question;
On which days equal number of toys were produced?


