
Kink or break on the axis in the histogram is marked before the first class interval.
Important Questions on Statistics
Study the given histogram that shows the marks obtained by students in an examination and answer the question that follows.
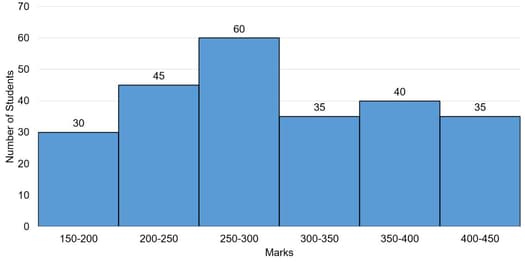
If the total marks obtained by students be represented as a pie chart, then the central angle of the sector representing marks or more but less than , is _____. (Correct to the nearest degree)
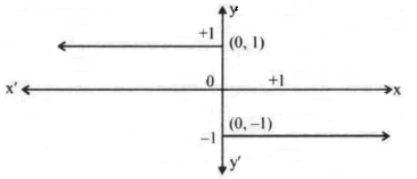
The equation of the graph shown here is:
The fasting blood sugar level () and the postprandial blood sugar level () of a patient was monitored for four weeks and , and the readings (in ) for the four weeks are as follows:
These have been presented through a bar graph. The normal range is considered to be:
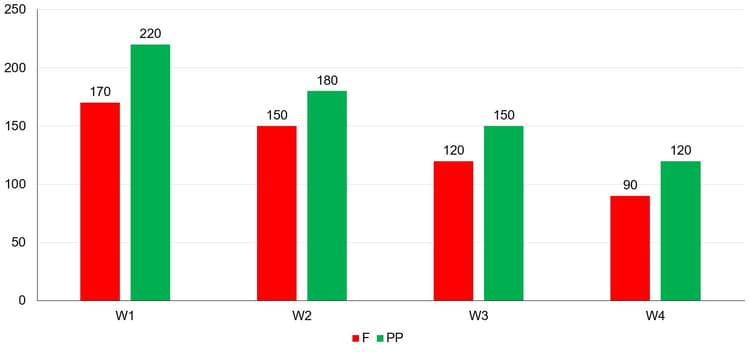
During which week was the fasting blood sugar level of the patient approximately above the upper limit of normal blood sugar level?
The given histogram shows the frequency distribution of the speed of cars passing through a particular spot on a highway. Read the graph and answer the following question.
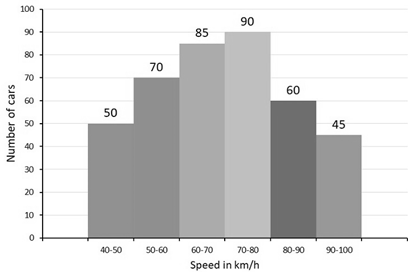
The number of cars with speed () in the interval () is what percentage less than the number of cars with speed () in the interval () ? (Correct to one decimal point)
Direction: Study the graph carefully to answer these question.
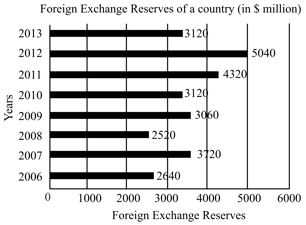
What is the percentage increase in the foreign reserves in over ?
The number of students in Class in Science, Arts and Commerce streams of a school over a period of years () has been depicted through the bar chart given below:
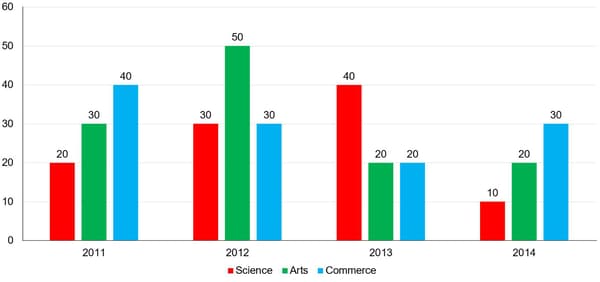
What is the difference between the averages of the number of Science and Commerce students in the given class over the given period of years?
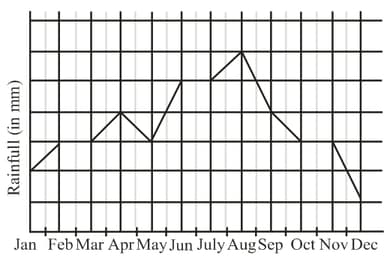
The above graph depicts the average monthly rainfall for a particular year in the country . Select the incorrect option :
The given graph shows the weights of students in a school on a particular day.
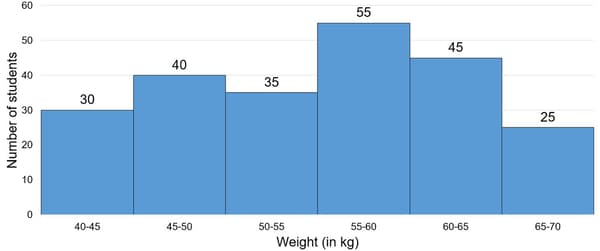
The number of students weighing less than is what percent less than the number of students weighing or more?
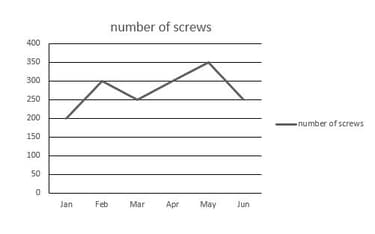
According to the chart below, in which month less than screws were manufactured?
Direction: Study the graph carefully to answer these question.

The foreign exchange reserve in was how many times that in ?
Study of the following bar graph and answer the question given:
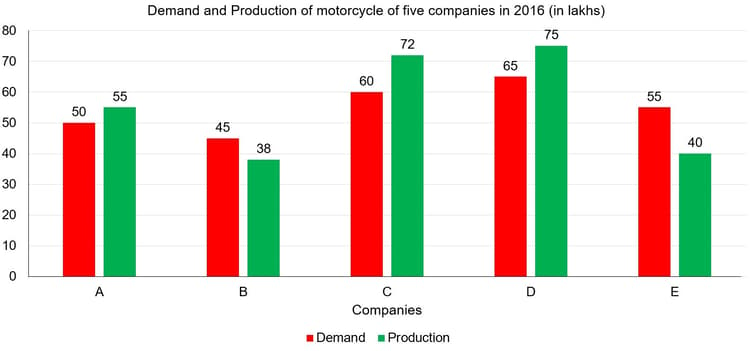
The total production of the motorcycle of companies C, D and E is what per cent less than the total demand of motorcycles of all the companies five years?
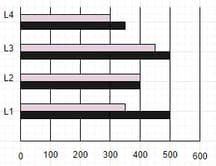
The bar chart represents number of fiction and non-fiction books in four libraries L1, L2, L3 and L4. Consider the bar chart and answer the question bsed on it -

| L1 | L2 | L3 | L4 | |
| Non-Fiction (Pink) | 350 | 400 | 450 | 300 |
| Fiction (Black) | 500 | 400 | 500 | 350 |
What is the percentage difference of total number of fiction books in libraries L3 and L4 to the non-fiction books in L3 and L4?
.
.
.
. It is the same
The line graph shows the production of A and B (in thousands) during the period to and the second line graph shows the percentage sale of these products.
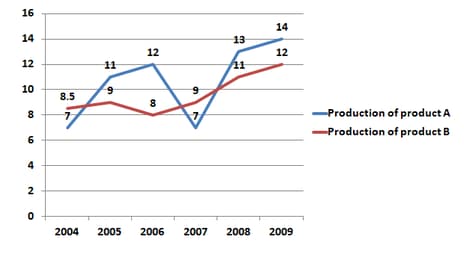
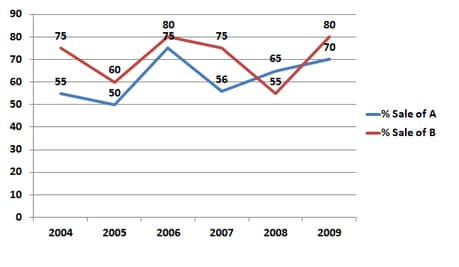
In the given line graph, what is the total sale of products A and B in the year
Study the given histogram that shows the marks obtained by students in an examination and answer the question that follows.

The number of students who obtained less than marks is what per cent more than the number of students who obtained or more marks? (Correct to one decimal place)
The given bar chart shows the sales (in thousands) for sets of television of three companies in three years.

In the given bar chart, What is the difference between the average sales of televisions BPL and Onida for ?
The given bar chart shows the sale (in thousands) for sets of television of three companies in three years.
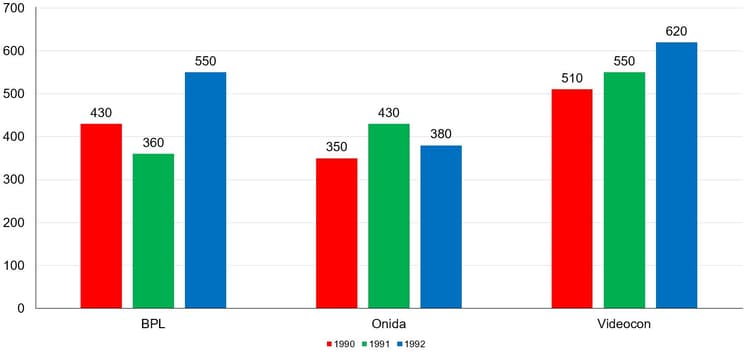
In the given bar chart, if the profit earned per television by Videocon in was , the total profit earned was:
Study the following bar graph and answer the question given:
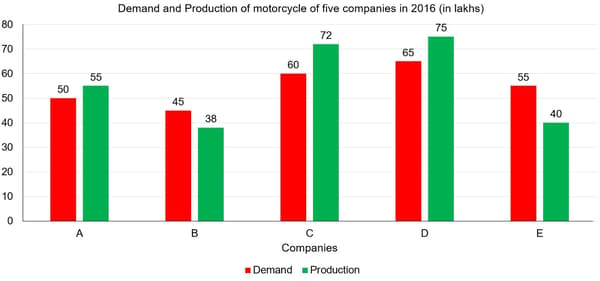
The number of companies whose production of the motorcycle is equal to or more than the average demand of motorcycles (per year) over five years is:
The graph below shows three types of grains produced(in tonnes) in four states A, B, C and D.
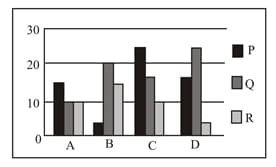
What percentage of grain Q is produced by state D out of the total quantity of Q produced by all states?
The bar chart represents number of fiction and non-fiction books in four libraries L1, L2, L3 and L4. Consider the bar chart and answer the question based on it:

| L1 | L2 | L3 | L4 | |
| Non-Fiction (Pink) | 350 | 400 | 450 | 300 |
| Fiction (Black) | 500 | 400 | 500 | 350 |
The ratio of total books of libraries L1 and L3 to L2 and L4 is:
The bar chart represents number of fiction and non-fiction books in four Libraries . Consider the bar chart and answer the question based on it.
| Non-Fiction (Pink) | ||||
| Fiction (Black) |
The ratio of total number of non-fiction to fiction books in all libraries is-
1.
2.
3.
4.


