HARD
11th CBSE
IMPORTANT
Earn 100

Literacy Rates of major states of India have the gap between maximum and minimum female literacy rates over the states in two consecutive census years 2001 and 2011. Check whether it has declined or not?

Literacy rates of major States in India

MAJOR INDIAN STATES 2001 MALE  2001 FEMALE 2011MALE 2011FEMALE
ANDHRA PRADESH 70.3 50.4 75.6 59.7
ASSAM 71.3 54.6 78.8 67.3
BIHAR 59.7 33.1 73.4 53.3
JHANRKHAND 67.3 38.9 78.4 56.2
GUJARAT 79.7 57.8 87.2 70.7
HARYANA 78.5 55.7 85.3 66.8
KARNATAKA 76.1 56.9 82.9 68.1
KERELA 94.2 87.7 96 92
MADHYA PRADESH 76.1 50.3 80.5 60
CHATTISGARH 77.4 51.9 81.5 60.6
MAHARASHTRA 86 67 89.8 75.5
ODISHA 75.3 50.5 82.4 64.4
PUNJAB 75.2 63.4 81.5 71.3
RAJASTHAN 75.7 43.9 80.5 52.7
TAMIL NADU 82.4 64.4 86.8 73.9
UTTAR PRADESH 68.8 42.2 79.2 59.3
UTTARAKHAND 83.3 59.6 88.3 70.7
WEST BENGAL 77.0 59.6 82.7 71.2
INDIA 75.3 53.7 82.1 65.5


Important Questions on Presentation of Data

HARD
11th CBSE
IMPORTANT

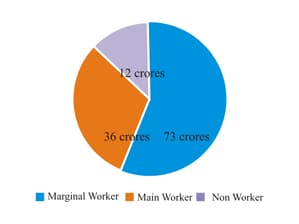
Represent data presented through figure by a component bar diagram.

Question Image

MEDIUM
11th CBSE
IMPORTANT
Does the area of a pie have any bearing on the total value of the data to be represented by the pie diagram?
EASY
11th CBSE
IMPORTANT
Bar diagram is a
MEDIUM
11th CBSE
IMPORTANT
Data represented through a histogram can help in finding graphically the
EASY
11th CBSE
IMPORTANT
Ogives can be helpful in locating graphically the
EASY
11th CBSE
IMPORTANT
Data represented through arithmetic line graph help in understanding.
MEDIUM
11th CBSE
IMPORTANT
Width of bars in a bar diagram need not be equal.
MEDIUM
11th CBSE
IMPORTANT
The width of rectangles in a histogram should essentially be equal.