
Look at the bar graph given below:

Study the bar graph carefully and answer the question given below:
In which week was the production maximum?
Important Questions on Bar Graph
Look at the bar graph given below:

Study the bar graph carefully and answer the question given below:
In which week was the production minimum?
Look at the bar graph given below:
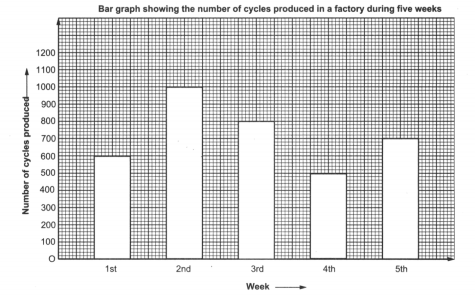
Study the bar graph carefully and answer the question given below:
What is the average production during these five weeks?
Look at the bar graph given below:

Study the bar graph carefully and answer the question given below:
How many cycles were produced in the first weeks?
students from a locality use different modes of transport to school, as shown by the bar graph given below:
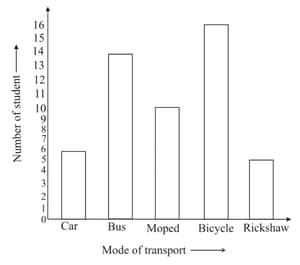
Look at the bar graph given above and answer the question given below:
What does the above bar graph show?
students from a locality use different modes of transport to school, as shown by the bar graph given below:
Look at the bar graph given above and answer the question given below:
Which mode of transport is used by maximum number of students?
students from a locality use different modes of transport to school, as shown by the bar graph given below:
Look at the bar graph given above and answer the question given below:
How many students use bus for going to school?
students from a locality use different modes of transport to school, as shown by the bar graph given below:
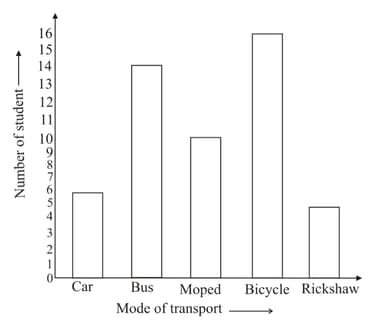
How many students of the locality do not use Bus for going to school?


