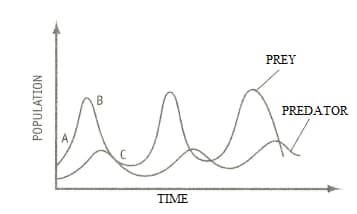
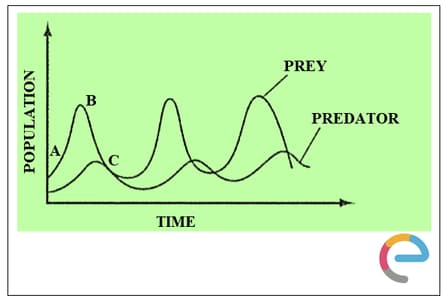
Look at the graph. It shows a typical variation of populations of predators (wolves, tigers, etc.) and prey (deer, rabbits, etc.) in habitats such as a forest.
Why is the predator population always lower than the prey population?
Important Questions on Our Forests
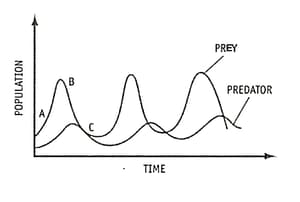
Look at the graph. It shows a typical variation of populations of predators (wolves, tigers, etc.) and prey (deer, rabbits, etc.) in habitat such as a forest.
Point A is the rainy season. Why is the prey population increasing?
Look at the graph. It shows a typical variation of populations of predators (wolves, tigers, etc.) and prey (deer, rabbits, etc.) in habitat such as a forest.
Why does the predator population start increasing after the increase in the prey population?

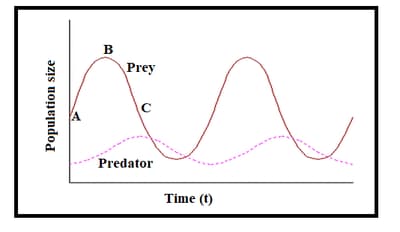
Look at the graph. It shows a typical variation of populations of predators (wolves, tigers, etc.) and prey (deer, rabbits, etc.) in habitat such as a forest.
As the predator population increases, why does the prey population starts declining (point B)?
Look at the graph. It shows a typical variation of populations of predators (wolves, tigers, etc.) and prey (deer, rabbits, etc.) in habitat such as a forest.
Why does the predator population now start to decrease? (point C)
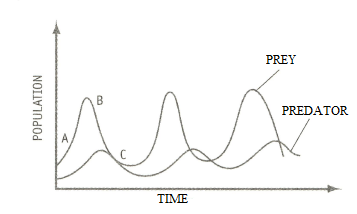
Look at the graph. It shows a typical variation of populations of predators (wolves, tigers, etc.) and prey (deer, rabbits, etc.) in habitat such as a forest.
Will the graph maintain the same shape if a calamity such as a disease struck the prey and they died in large numbers? What do you expect will happen?