
Look at the histogram below and answer the questions that follow.
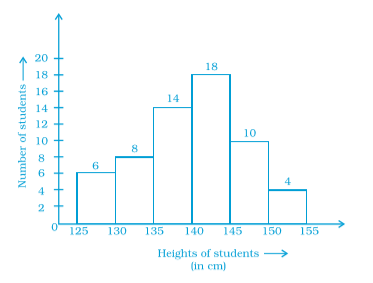
How many students have height less than ?
Important Questions on Data Handling
Following are the number of members in families of a village:
.
Prepare a frequency distribution table for the data using class intervals etc.
Following are the number of members in families of a village:
.
Prepare a frequency distribution table for the data using class intervals etc.
Draw a histogram to represent the frequency distribution..
Prepare a frequency distribution table for the above data using class Intervals of equal width in which one class interval is (excluding
and including ).
The marks obtained (out of ) by students of a class in a test are as follows:
.
Prepare a frequency distribution table for the above data using class Intervals of equal width in which one class interval is (excluding
and including ).
Prepare a histogram from the frequency distribution table obtained.
The weights (in ) of students of a class are:
.
Prepare a frequency distribution table using one class interval as not included.
Which class has the least frequency?
The weights (in ) of students of a class are:
.
When a frequency distribution table using class intervals like not included is prepared, then the class which has the maximum frequency is
Shoes of the following brands are sold in at a shoe store. Construct a pie chart for the data.
| Brand | Number of pairs of shoes sold |
The following pie chart depicts the expenditure of a state government under different heads.
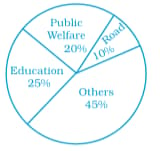
If the total spending is crores, how much crores of money was spent on roads?


