
Observe the given bar graph and state whether the given statement is true or false:
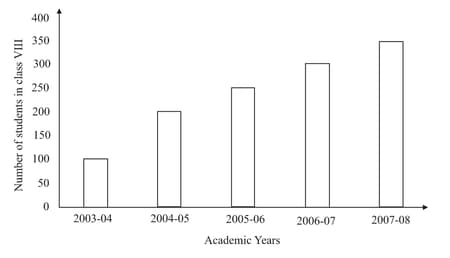
The number of student during is twice that of .
Important Questions on Data Handling
Observe the given bar graph and answer the following question:
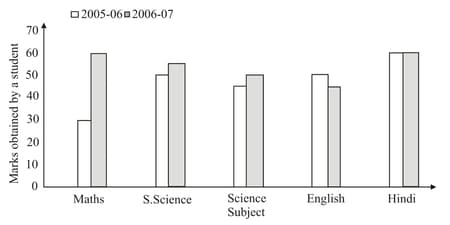
What is the information given by the double graph?
Observe the given bar graph and answer the following question:
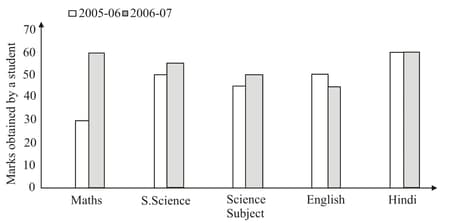
In which subject has the performance improved the most?
Observe the given bar graph and answer the following question:

In which subject has the performance deteriorated?
Observe the given bar graph and answer the following question:

In which subject has the performance at par?
Draw an appropriate graph to represent the given information.
Draw an appropriate graph to represent the given information.
| Children who prefer | School A | School B | School C |
| Walking | |||
| Cycling |
Draw an appropriate graph to represent the percentage wins in ODI by top cricket teams.
| Teams | From Champions trophy to world cup | Last ODI in |
| South Africa | ||
| Australia | ||
| Sri Lanka | ||
| New Zealand | ||
| England | ||
| Pakistan | ||
| West Indies | ||
| India |
A group of students were asked to say which animal they would like most to have as a pet. The results are given below:
dog, cat, cat, fish, cat, rabbit, dog, cat, rabbit, dog, cat, dog, dog, dog, cat, cow, fish, rabbit, dog, cat, dog, cat, cat, dog, rabbit, cat, fish, dog.
Make a frequency distribution table for the same.


