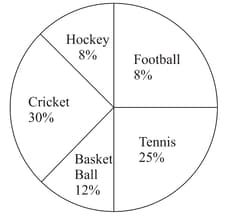
On adding all the percentages in the given circle, we get sum as
.
Important Questions on Data Handling
A survey was conducted in a class to find the preference of students for the soft drinks and recorded as follows:
| Soft drinks | Number of students |
|
Orange juice Cola Lime juice Mango juice Melon Juice |
Make a bar graph with a suitable scale for the above data.
The daily wage of a person in rural area is Rs. 200 an the poverty line for a person is fixed at Rs. 800 per month for rural areas. Following table shows the detail of employment of four families living in a village. Identify the family living below poverty line:
| Family | Total days of Employment of got in a month by the family | Members of family |
| Ram | 10 | 2 |
| Radha | 18 | 3 |
| Raju | 12 | 4 |
| Pooja | 25 | 5 |
A profit of was made on
Bar graphs are _____ representation of ungrouped data.
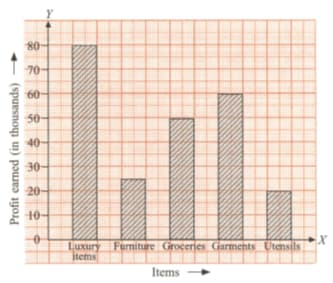
The graph in figure below shows the profit earned by a general store on different items in March . A difference of in profit was between
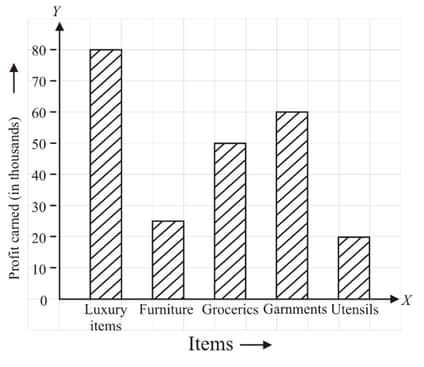
The graph in Figure 2 shows the profit earned by a general store on different items in March . Observe the graph and select the correct answer.

Maximum profit was earned on
The pictograph shows the number of cars produced by a company during the third quarter of year .
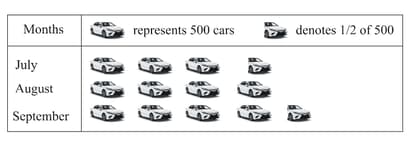
Observe the above pictograph and list number of cars produced in the month of July is _____.
The graph in Figure 2 shows the profit earned by a general store on different items in March . Observe the graph and select the correct answer.
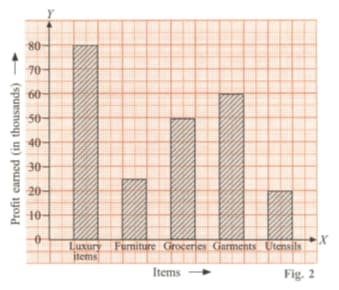
The ratio of profits on luxury items to the profit on garments is
The following bar graph shows the number of hours of sunshine on each of the days of a week.
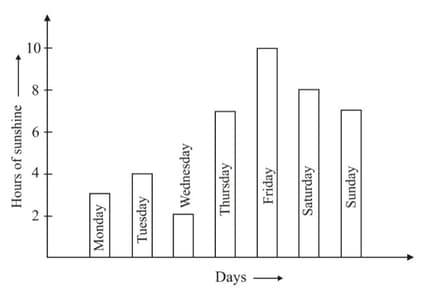
The sunshine was for the minimum number of hours on _____.
The pictograph shows the number of cars produced by a company during the third quarter of the year .
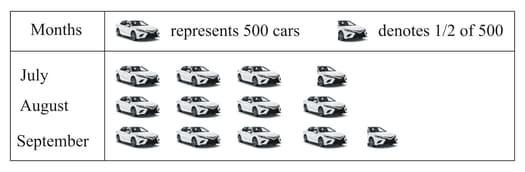
Observe the above pictograph and fill in the blank.
The total number of cars produced during the year is _____ .
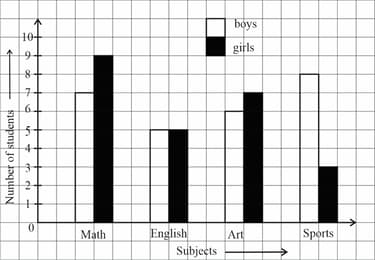
The graph given below shows the favourite subjects of boys and girls of grade of a school. Which subject was liked the most by both boys and girls?