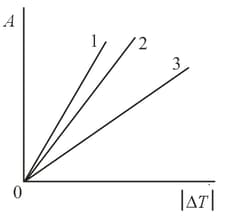
One of the straight lines in the figure depicts the dependence of the work done on the temperature variations for an isobaric process. The other two are the adiabatic curves for argon and nitrogen. Which straight line corresponds to which process? How should one depict an isotherm and an isochor in these coordinates? Bear in mind that on the horizontal axis we lay off the difference between the higher and the lower temperature.
Important Questions on Molecular Physics and Thermodynamics
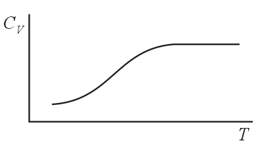
For temperatures close to room temperature and somewhat higher, the molar heat capacity of hydrogen agrees, with good accuracy, with the results predicted by the classical theory of heat capacity for ideal gases, a theory that allows for three translational and two rotational degrees of freedom for diatomic gases. However, at low temperatures the heat capacity of hydrogen drops and at about becomes the same as that of a monatomic gas. What is the explanation for this? Why such behavior is not observed in other diatomic gases?
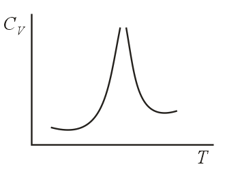
When diatomic gases are heated, their heat capacity exhibits a peak in the high-temperature region. Similar behavior is observed in multiatomic gases. What is the explanation for this?
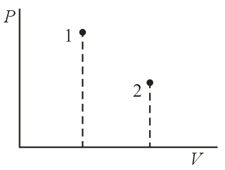
A gas is transferred from a state to a state by two processes: () first by an isochor and then by an isobar, and () first by an isobar and then by an isochor. Will the work done in both cases be the same, will the amount of heat required in the processes be the same, and will the increment of entropy in the processes be the same?
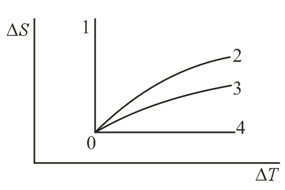
A gas is transferred from an initial state to other states and via different isoprocesses. Which curve representing the dependence of entropy on temperature corresponds to which process?