
Paired, bivariate data that is strongly correlated has a on line of best fit of . When , an estimate for is . When , an estimate for is
State if there is positive or negative correlation.
State if there is positive or negative correlation.
Important Questions on Modelling Relationships between Two Data Sets: Statistics for Bivariate Data
Paired, bivariate data that is strongly correlated has a on line of best fit of . When , an estimate for is . When , an estimate for is
The value of is , find the value of .
Paired, bivariate data that is strongly correlated has a on line of best fit of . When , an estimate for is . When , an estimate for is
When find an estimate for the value of , given that this is interpolation.
The temperature, , of liquid in a chemical reaction is a function of time, , in seconds, where is the time from when the experiment started. The relationship is given by the equation:
Find the initial temperature of the liquid and the temperature of the liquid after .
1: The temperature , of liquid in a chemical reaction is a function of time , in seconds, where is the time from when the experiment started. The relationship is given by the equation:
Find the maximum temperature that the liquid reaches.
The temperature,, of liquid in a chemical reaction is a function of time, , in seconds, where is the time from when the experiment started. The relationship is given by the equation:
Find the initial temperature of the liquid. Sketch a graph of as a function of .
The temperature,, of liquid in a chemical reaction is a function of time, , in seconds, where is the time from when the experiment started. The relationship is given by the equation:
Ten teenagers were asked their age and the number of brothers and sisters they have. The data are shown in the scatter diagram below, where represents the teenager's age and represents the number of brothers and sisters that they have.
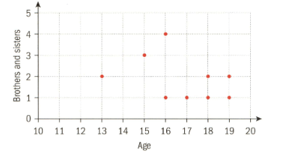
Use the scatter diagram to copy and complete the following table.
Ten teenagers were asked their age and the number of brothers and sisters they have. The data are shown in the scatter diagram below, where represents the teenager's age and represents the number of brothers and sisters that they have.
Calculate the Pearson product moment correlation coefficient for this data.


